PCL - The Performance Counter Library:
A Common Interface to Access Hardware Performance Counters on Microprocessors
(Version 2.2)
Rudolf Berrendorf
University of Applied Sciences Bonn-Rhein-Sieg
Computer Science Department
53754 Sankt Augustin, Germany
rudolf.berrendorf@h-brs.de
Bernd Mohr
Research Centre Juelich GmbH
Central Institute for Applied Mathematics
52425 Juelich, Germany
b.mohr@fz-juelich.de
Abstract:
A performance counter is that part of a microprocessor that measures
and gathers performance-relevant events on the microprocessor. The
number and type of available events differ significantly between
existing microprocessors, because there is no commonly accepted
specification, and because each manufacturer has different priorities
on analyzing the performance of architectures and programs. Looking at
the supported events on the different microprocessors, it can be
observed that the functionality of these events differs from the
requirements of an expert application programmer or a performance tool
writer.
PCL, the Performance Counter Library,
establishes a common platform for performance measurements on a wide
range of computer systems. With a common interface on all systems and
a set of application-oriented events defined, the application
programmer is able to do program optimization in a portable way and
the performance tool writer is able to rely on a common interface on
different systems. A low-level interface gives the user direct access
to the hardware performance counters to measure non-standard events.
PCL
has functions to query the
functionality, to start and to stop counters, and to read the values
of counters. Performance counter values are returned as 64 bit
integers (or floating point numbers for some events) on all
systems. PCL supports nested calls to PCL functions thus allowing
hierarchical performance measurements. Counting may be done either in
system or in user mode. All interface functions are callable in C,
C++, Fortran, and Java.
This report describes performance counters on
all major microprocessors families and introduces a common interface
to access these counters. With performance counters, performance
critical events can be counted. This includes all aspects concerning
the memory hierarchy (loads/stores, misses/hits, different cache
levels, etc.), functional units or pipelines (operation counts,
stalls, issues), duration of requests, etc.
As will be shown, the number of, type of, and access to events differs
significantly between the processors and the type of supported events
might be not very helpful to the application programmer or tool
builder who might have different demands of countable events.
To overcome this lack of common platform, we developed
PCL, the Performance Counter Library.
We first defined a set of events useful to the application programmer
and tool builder, and second, established a set of access functions to
control and access the performance counters on different platforms.
PCL is implemented on many of todays machines ranging from a PC
running Linux to parallel systems capable of Teraflops and it is
callable from application programs as well as from tools.
The Performance Counter Library PCL is available at
and
Requirements of Application Programmers
People from different areas of computer science and electrical
engineering may see different events as most useful for their
optimization purposes. Most of the events described so far in the
description of the microprocessors are likely most useful to the
computer architect, hardware engineer, or low-level device driver
writer.
Application programmers optimizing their programs or performance tool
writers wish to get performance relevant information related to their
programs rather than counting signal switches on certain pins of a
chip module. Therefore, those parts of the microprocessor which have
appropriate counterparts in a program are most likely to be used by
the application programmer to optimize programs. The memory hierarchy
in a computer system corresponds directly to program variables and the
functional units execute the operations specified in a
program. Therefore, we concentrate on those aspects of a computer
system.
Our impression is, that taking the union of all available events of
all microprocessors is not the right way to define an application
interface for an application programmer or tool writer. Our approach
is to define a set of events relevant to the user. If
microprocessor architecture or programming methodology precedes in a
different direction (we don't see that for the near future!), the set
of events might then be extended or changed.
Although hardware counters give numbers for a processor, performance
numbers should be related to a process (representing the program).
Therefore, either the executing process should be bound to a
processor, or migrating a process to another processor should be
transparent to the process (related to performance counting). Using
the second approach needs support of the operating system.
We have categorized the useful events into categories as shown in the
following sections.
Currently, most computer systems support four levels in the memory
hierarchy: registers, 1st level cache, 2nd level cache, main
memory. Registers are directly controlled by a compiler, so for
example, the information how many registers keep live values could be
better managed by a compiler. Although main memory statistics could be
quite useful in performance analysis (e.g. bank conflicts),
performance counters in microprocessors mostly see the main memory as
a black box. Therefore, we concentrate on 1st and 2nd level caches.
Accesses to caches can be distinguished by read or write accesses,
instruction loads and instruction stores (fetches from a higher level
in the hierarchy), or data load/stores. An important performance
aspect is the hit and miss rate, which can be calculated from the
total number of accesses and either the number of misses or hits. Most
microprocessors use (small) translation look-aside buffers (TLB) to
speed up the translation of virtual to physical addresses. As misses in
the TLB are time consuming, this number (and its relation to the
number of hits or the total number of address lookups) is a relevant
number for performance optimization.
We distinguish between instruction and data caches on each level. For
unified caches (i.e. instruction and data are buffered in the same
cache), it is often possible to distinguish instruction and data
loads. Therefore on those caches, PCL_LxICACHE_xxx and PCL_LxDCACHE_xxx refer to events concerning instruction and data
accesses, respectively.
The available events concerning memory hierarchy are given in table
2.1.
Table 2.1:
Events concerning memory hierarchy (x=1 or 2 for 1st or 2nd
level cache)
| cache |
|
| PCL_LxCACHE_READ |
number of level-x cache reads |
| PCL_LxCACHE_WRITE |
number of level-x cache writes |
| PCL_LxCACHE_READWRITE |
number of level-x cache reads or writes |
| PCL_LxCACHE_HIT |
number of level-x cache hits |
| PCL_LxCACHE_MISS |
number of level-x cache misses |
| data cache |
|
| PCL_LxDCACHE_READ |
number of level-x data cache reads |
| PCL_LxDCACHE_WRITE |
number of level-x data cache writes |
| PCL_LxDCACHE_READWRITE |
number of level-x data cache reads or writes |
| PCL_LxDCACHE_HIT |
number of level-x data cache hits |
| PCL_LxDCACHE_MISS |
number of level-x data cache misses |
| instruction cache |
|
| PCL_LxICACHE_READ |
number of level-x instruction cache reads |
| PCL_LxICACHE_WRITE |
number of level-x instruction cache writes |
| PCL_LxICACHE_READWRITE |
number of level-x instruction cache reads or writes |
| PCL_LxICACHE_HIT |
number of level-x instruction cache hits |
| PCL_LxICACHE_MISS |
number of level-x instruction cache misses |
| TLB |
|
| PCL_TLB_HIT |
number of hits in TLB |
| PCL_TLB_MISS |
number of misses in TLB |
| Instruction TLB |
|
| PCL_ITLB_HIT |
number of hits in instruction TLB |
| PCL_ITLB_MISS |
number of misses in instruction TLB |
| Data TLB |
|
| PCL_DTLB_HIT |
number of hits in data TLB |
| PCL_DTLB_MISS |
number of misses in data TLB |
|
Due to the definition, the sum of cache reads and cache writes should
be equal to cache read/writes and the the sum of cache hits and cache
misses should be equal to cache read/writes, too. Additionally, if two
first level caches exist (instruction and data), the sum of
instruction cache reads and data cache reads should be equal to cache
reads (and so on).
Instructions correspond to operations and flow control specified in a
program. There are several categories of operations (e.g. integer,
logical, floating point) which might be executed by different
functional units in the microprocessor. Another aspect (in
multiprocessor systems) is atomic operations (e.g. a primitive for a
test-and-set-operations) which can be executed successful (the lock
could be set) or unsuccessful (the lock could not be acquired as it
was already set). We distinguish between the instruction categories
as shown in table 2.2.
Additionally, we have included a cycle count which gives the number of
cycles spent in this process or on behalf of the process/thread (when
counting in user-and-system mode). For clarification, it should be
noted that the cycle count should not be used to count the number of
elapsed cycles as on multiprogramming systems other processes might be
scheduled to the same processor. To count the number of elapsed
cycles, an additional event can be used (PCL_ELAPSED_CYCLES).
On some systems, the number of issued instructions might be different
to the number of completed instructions due to some error
conditions. We have chosen completed instructions, as they correspond
more closely to the operations the programmer specified in his
program.
Getting the number of operations out of the number of instructions is
difficult. For example, on some systems a floating-point add and a
floating-point multiply can be initiated by a single add-and-multiply
instruction. Therefore, 1 floating point instruction is counted but 2
floating point operations are executed. With PCL (and most of all
hardware performance counter implementations) it is not possible to
count the number of floating point operations and related
number.
Table 2.2:
Events concerning instruction categories
| PCL_CYCLES |
spent cycles in process/thread (and eventually in system calls) |
| PCL_ELAPSED_CYCLES |
elapsed cycles |
| PCL_INTEGER_INSTR |
number of completed integer (or logical) instructions |
| PCL_FP_INSTR |
number of completed floating point instructions |
| PCL_LOAD_INSTR |
number of completed load instructions |
| PCL_STORE_INSTR |
number of completed store instructions |
| PCL_LOADSTORE_INSTR |
number of completed load or store instructions |
| PCL_INSTR |
sum of all completed instructions |
| PCL_JUMP_SUCCESS |
number of correctly predicted branches |
| PCL_JUMP_UNSUCCESS |
number of mispredicted branches |
| PCL_JUMP |
sum of all branches |
| PCL_ATOMIC_SUCCESS |
number of successful atomic instructions |
| PCL_ATOMIC_UNSUCCESS |
number of unsuccessful atomic instructions |
| PCL_ATOMIC |
sum of all instructions concerning atomic operations |
|
Functional units might be stalled due to blocked resources, missing
operands etc. Table 2.3 gives the events defined for
stalls. Measuring such an event results (different to all other
events) not in the number of stalls but in the number of cycles all
stalls of this event type have taken.
Table 2.3:
Events concerning functional unit stalls (numbers given in cycles)
| PCL_STALL_INTEGER |
number of cycles the integer/logical unit is stalled |
| PCL_STALL_FP |
number of cycles the floating point unit is stalled |
| PCL_STALL_JUMP |
number of cycles the branch unit is stalled |
| PCL_STALL_LOAD |
number of cycles the load unit is stalled |
| PCL_STALL_STORE |
number of cycles the store unit is stalled (write buffer) |
| PCL_STALL |
sum of all cycles a unit is stalled |
|
Often, it is useful to get a ratio or rate rather than an absolute
number. Good examples are cache miss rates or floating point
operations per second. Table 2.4 gives the events
defined for such rates and ratios.
Table 2.4:
Events concerning rates and rations (numbers are floating point values)
| PCL_MFLOPS |
number of million floating point instructions per second |
| PCL_IPC |
number of completed instructions per cycle |
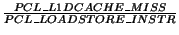
| PCL_L1DCACHE_MISSRATE |
miss rate of L1 data cache |
| PCL_L2DCACHE_MISSRATE |
miss rate for L2 data cache |
| PCL_MEM_FP_RATIO |
ratio of memory references to floating point operations |
|
Measuring these events will mostly be done by deriving the values from
other performance numbers (see [1]). The definitions are
as follows:
- PCL_MFLOPS :

- PCL_IPC :
- PCL_L1DCACHE_MISSRATE :

- PCL_L2DCACHE_MISSRATE :
- PCL_MEM_FP_RATIO :

The Performance Counter Library has a programming interface to access
a set of performance counters with a defined set of countable
events. In section 3.1, we specify which of the events
defined in chapter 2 are available on what
systems and in section 3.2 we define the programming
interface. Additionally, we provide a uniform low-level interface to
directly access performance counters on a microprocessor to measure
non-standard events.
Countable Events
In the following tables we compare the events defined in the last
section in tables 2.1 to 2.3 with the
available events on the microprocessors currently supported by PCL.
The tables are given in the following scheme. Each entry in the
tables specifies if a processor supports the PCL event, and if so,
what the corresponding event is. The entry names correspond to the
event names in the description of the microprocessors (see chapter
A. Empty entries signal that such an event is not
available on that microprocessor. Entries in itaic are indirect events
as a combination of several other events directly countable by a
(hardware) performance counter. Counters used for indirect events can
not be used at the same time to measure their own events. Therefore,
on a processor any combination of PCL events is possible which does
not generate any ressource conflict.
Table 3.1 shows events relevant to the 1st level cache
(instruction and data), table 3.2 shows events relevant to
the 1st level data cache, and table 3.3 shows events
relevant to the 1st level instruction cache. Tables 3.4,
3.5, and 3.6 show events relevant to the 2nd
level cache (instruction and data, data, instruction,
respectively). If there is a unified cache for data and instructions
(as it is on most systems), events defined for 2nd level instruction
cache refer to cache references done by instruction fetches, and for
the data cache accordingly. Table 3.7 shows events for the
translation look-aside buffers (instruction, data, instruction and
data). Table 3.8 shows spent cycles, tables
3.10 and 3.9 shows events
relevant to instructions, table 3.11 shows events regarding
branch instructions, and table 3.12 shows events ragarding
atomic instructions. Table 3.13 shows events concerning units
which are blocked/stalled. Instead of counting the number of events,
the number in this table gives the number of cycles for the event
type. Table 3.14 shows the events concerning rates
and ratios.
Table 3.1:
1st level cache
| processor |
PCL_L1CACHE_READ |
PCL_L1CACHE_WRITE |
PCL_L1CACHE_READWRITE |
PCL_L1CACHE_HIT |
PCL_L1CACHE_MISS |
| Alpha |
|
|
|
|
|
| 21164 |
|
|
|
|
|
| 21264 |
|
|
|
|
|
| MIPS |
|
|
|
|
|
| R10k |
|
|
|
|
R10k_C1_9+R10k_C0_9 |
| R12k |
|
|
|
|
R12k_9+R12k_25 |
| SPARC |
|
|
|
|
|
| Ultra I/II |
|
|
|
|
|
| Ultra III |
|
|
|
|
|
| PowerPC |
|
|
|
|
|
| PPC604 |
|
|
|
|
PPC604_C0_5+PPC604_C1_6 |
| PPC604e |
|
|
|
|
PPC604e_C0_5+PPC604e_C1_6 |
| POWER3 |
|
|
|
|
POWER3_C0_6+POWER3_C1_9 |
| POWER3-II |
|
|
|
|
POWER3II_C0_6+POWER3II_C1_9 |
| Intel |
|
|
|
|
|
| Pentium MMX |
|
|
|
|
|
| Pro,PII,PIII |
|
|
|
|
|
| Pentium 4 |
|
|
|
|
|
| AMD |
|
|
|
|
|
| Athlon |
|
|
|
|
|
| Hitachi |
|
|
|
|
|
| SR8000 |
|
|
|
|
|
|
Table 3.2:
1st level data cache
| processor |
PCL_L1DCACHE_READ |
PCL_L1DCACHE_WRITE |
PCL_L1DCACHE_READWRITE |
PCL_L1DCACHE_HIT |
PCL_L1DCACHE_MISS |
| Alpha |
|
|
|
|
|
| 21164 |
|
|
21164_C1_14 |
21164_C1_14-21164_C2_5 |
21164_C2_5 |
| 21264 |
|
|
|
|
|
| MIPS |
|
|
|
|
|
| R10k |
|
|
|
|
R10k_C1_9 |
| R12k |
|
|
|
|
R12k_25 |
| SPARC |
|
|
|
|
|
| Ultra I/II |
ULTRA_C0_5 |
ULTRA_C0_6 |
|
|
ULTRA_C0_1 |
| Ultra III |
ULTRA3_C0_9 |
ULTRA3_C0_10 |
|
|
|
| PowerPC |
|
|
|
|
|
| PPC604 |
|
|
|
|
PPC604_C1_6 |
| PPC604e |
|
|
|
|
PPC604e_C1_6 |
| POWER3 |
|
|
|
|
POWER3_C0_17,POWER3_C1_19,POWER3_C5_0 |
| POWER3-II |
|
|
|
|
POWER3II_C0_17,POWER3II_C1_19,POWER3II_C5_0 |
| Intel |
|
|
|
|
|
| Pentium MMX |
Pentium_0 |
Pentium_1 |
Pentium_0+Pentium_1 |
|
Pentium_37 |
| Pro,PII,PIII |
|
|
|
|
PPro_1 |
| Pentium 4 |
|
|
|
|
P4_CG4_16 |
| AMD |
|
|
|
|
|
| Athlon |
|
|
ATHLON_2 |
ATHLON_2-ATHLON_3 |
ATHLON_3 |
| Hitachi |
|
|
|
|
|
| SR8000 |
|
|
|
|
SR8000_C3 |
|
Table 3.3:
1st level instruction cache
| processor |
PCL_L1ICACHE_READ |
PCL_L1ICACHE_WRITE |
PCL_L1ICACHE_READWRITE |
PCL_L1ICACHE_HIT |
PCL_L1ICACHE_MISS |
| Alpha |
|
|
|
|
|
| 21164 |
|
|
21164_C1_13 |
21164_C1_13-21164_C2_3 |
21164_C2_3 |
| 21264 |
|
|
|
|
|
| MIPS |
|
|
|
|
|
| R10k |
|
|
|
|
R10k_C0_9 |
| R12k |
|
|
|
|
R12k_9 |
| SPARC |
|
|
|
|
|
| Ultra I/II |
|
|
ULTRA_C0_4 |
ULTRA_C1_4 |
ULTRA_C0_4-ULTRA_C1_4 |
| Ultra III |
ULTRA3_C0_8 |
|
|
ULTRA3_C0_8-ULTRA3_C1_8 |
ULTRA3_C1_8 |
| PowerPC |
|
|
|
|
|
| PPC604 |
|
|
|
|
PPC604_C0_5 |
| PPC604e |
|
|
|
|
PPC604e_C0_5 |
| POWER3 |
|
|
|
POWER3_C4_1 |
POWER3_C0_5,POWER3_C6_0 |
| POWER3-II |
|
|
|
POWER3II_C4_1 |
POWER3II_C0_5,POWER3II_C6_0 |
| Intel |
|
|
|
|
|
| Pentium MMX |
Pentium_12 |
|
|
|
Pentium_14 |
| Pro,PII,PIII |
PPro_5 |
|
|
|
PPro_6 |
| Pentium 4 |
|
|
|
|
|
| AMD |
|
|
|
|
P4_CG1_0 |
| Athlon |
ATHLON_18 |
|
|
ATHLON_18-ATHLON_19 |
ATHLON_19 |
| Hitachi |
|
|
|
|
|
| SR8000 |
|
|
|
|
SR8000_C2 |
|
Table 3.4:
2nd level cache
| processor |
PCL_L2CACHE_READ |
PCL_L2CACHE_WRITE |
PCL_L2CACHE_READWRITE |
PCL_L2CACHE_HIT |
PCL_L2CACHE_MISS |
| Alpha |
21164_C1_16 |
21164_C1_17 |
21164_C1_15 |
21164_C1_15-21164_C2_14 |
21164_C2_14 |
| 21164 |
|
|
|
|
|
| 21264 |
|
|
|
|
|
| MIPS |
|
|
|
|
|
| R10k |
|
|
|
|
R10k_C1_10+R10k_C0_10 |
| R12k |
|
|
|
|
R12k_26+R12k_10 |
| SPARC |
|
|
|
|
|
| Ultra I/II |
|
|
ULTRA_C0_8 |
ULTRA_C1_8 |
ULTRA_C1_9 |
| Ultra III |
|
|
ULTRA3_C0_12 |
ULTRA3_C0_12-ULTRA3_C1_12 |
ULTRA3_C1_12 |
| PowerPC |
|
|
|
|
|
| PPC604 |
|
|
|
|
|
| PPC604e |
|
|
|
|
|
| POWER3 |
|
|
|
|
POWER3_C1_21 |
| POWER3-II |
|
|
|
|
POWER3II_C1_21 |
| Intel |
|
|
|
|
|
| Pentium MMX |
|
|
|
|
|
| Pro,PII,PIII |
|
|
PPro_17 |
|
PPro_13 |
| Pentium 4 |
P4_CG1_10,11,12,13 |
|
|
P4_CG1_10,11,12 |
P4_CG1_13 |
| AMD |
|
|
|
|
|
| Athlon |
|
|
ATHLON_16 |
|
|
| Hitachi |
|
|
|
|
|
| SR8000 |
|
|
|
|
|
|
Table 3.5:
2nd level data cache
| processor |
PCL_L2DCACHE_READ |
PCL_L2DCACHE_WRITE |
PCL_L2DCACHE_READWRITE |
PCL_L2DCACHE_HIT |
PCL_L2DCACHE_MISS |
| Alpha |
|
|
|
|
|
| 21164 |
|
|
|
|
|
| 21264 |
|
|
|
|
|
| MIPS |
|
|
|
|
|
| R10k |
|
|
|
|
R10k_C1_10 |
| R12k |
|
|
|
|
R12k_26 |
| SPARC |
|
|
|
|
|
| Ultra I/II |
|
|
|
|
|
| Ultra III |
|
|
|
|
|
| PowerPC |
|
|
|
|
|
| PPC604 |
|
|
|
|
|
| PPC604e |
|
|
|
|
|
| POWER3 |
|
|
|
|
|
| POWER3-II |
|
|
|
|
|
| Intel |
|
|
|
|
|
| Pentium MMX |
|
|
|
|
|
| Pro,PII,PIII |
PPro_11 |
PPro_12 |
PPro_11+PPro_12 |
|
|
| Pentium |
|
|
|
|
|
| AMD |
|
|
|
|
|
| Athlon |
|
|
|
|
|
| Hitachi |
|
|
|
|
|
| SR8000 |
|
|
|
|
|
|
Table 3.6:
2nd level instruction cache
| processor |
PCL_L2ICACHE_READ |
PCL_L2ICACHE_WRITE |
PCL_L2ICACHE_READWRITE |
PCL_L2ICACHE_HIT |
PCL_L2ICACHE_MISS |
| Alpha |
|
|
|
|
|
| 21164 |
|
|
|
|
|
| 21264 |
|
|
|
|
|
| MIPS |
|
|
|
|
|
| R10k |
|
|
|
|
R10k_C0_10 |
| R12k |
|
|
|
|
R12k_10 |
| SPARC |
|
|
|
|
|
| Ultra I/II |
|
|
|
|
|
| Ultra III |
|
|
|
|
|
| PowerPC |
|
|
|
|
|
| PPC604 |
|
|
|
|
|
| PPC604e |
|
|
|
|
|
| POWER3 |
|
|
|
|
|
| POWER3-II |
|
|
|
|
|
| Intel |
|
|
|
|
|
| Pentium MMX |
|
|
|
|
|
| Pro,PII,PIII |
|
|
|
|
|
| Pentium 4 |
|
|
|
|
|
| AMD |
|
|
|
|
|
| Athlon |
|
|
|
|
|
| Hitachi |
|
|
|
|
|
| SR8000 |
|
|
|
|
|
|
Table 3.7:
Transfer-Look-aside-Buffer
| processor |
PCL_TLB_HIT |
PCL_TLB_MISS |
PCL_ITLB_HIT |
PCL_ITLB_MISS |
PCL_DTLB_HIT |
PCL_DTLB_MISS |
| Alpha |
|
|
|
|
|
|
| 21164 |
|
|
|
21164_C2_4 |
|
21164_C2_6 |
| 21264 |
|
|
|
21264_C1_5 |
|
|
| MIPS |
|
|
|
|
|
|
| R10k |
|
R10k_C1_7 |
|
|
|
|
| R12k |
|
R12k_23 |
|
|
|
|
| SPARC |
|
|
|
|
|
|
| Ultra I/II |
|
|
|
|
|
|
| Ultra III |
|
|
|
ULTRA3_C1_17 |
|
ULTRA3_C1_18 |
| PowerPC |
|
|
|
|
|
|
| PPC604 |
|
PPC604_C0_6+PPC604_C1_7 |
|
PPC604_C1_7 |
|
PPC604_C0_6 |
| PPC604e |
|
PPC604e_C0_6+PPC604e_C1_7 |
|
PPC604e_C1_7 |
|
PPC604e_C0_6 |
| POWER3 |
|
POWER3_C0_19,POWER3_C8_0 |
|
|
|
|
| POWER3-II |
|
POWER3II_C0_19,POWER3II_C8_0 |
|
|
|
|
| Intel |
|
|
|
|
|
|
| Pentium MMX |
|
|
|
Pentium_13 |
|
Pentium_2 |
| Pro,PII,PIII |
|
|
|
PPro_7 |
|
|
| Pentium 4 |
|
|
|
P4_CG1_9 |
|
P4_CG1_8 |
| AMD |
|
|
|
|
|
|
| Athlon |
|
|
|
ATHLON_23 |
|
ATHLON_8 |
| Hitachi |
|
|
|
|
|
|
| SR8000 |
|
|
|
SR8000_C0 |
|
SR8000_C1 |
|
Table 3.8:
Cyles
| processor |
PCL_CYCLES |
PCL_ELAPSED_CYCLES |
| Alpha |
|
|
| 21164 |
21164_C0_0 |
21164_PCC3.1 |
| 21264 |
21264_C0_0, 21264_C1_0 |
21264_PCC |
| MIPS |
|
|
| R10k |
R10k_C0_0, R10k_C1_0 |
|
| R12k |
R12k_0 |
|
| SPARC |
|
|
| Ultra I/II |
ULTRA_C0_0, ULTRA_C1_0 |
ULTRA_TC |
| Ultra III |
ULTRA3_C0_0,ULTRA3_C1_0 |
ULTRA3_TC |
| PowerPC |
|
|
| PPC604 |
PPC604_C0_1, PPC604_C1_1 |
|
| PPC604e |
PPC604e_C0_1,PPC604e_C1_1,PPC604e_C2_1,PPC604e_C3_1 |
|
| POWER3 |
POWER3_C0_1 and other |
|
| POWER3-II |
POWER3II_C0_1 and other |
|
| Intel |
|
|
| Pentium MMX |
Pentium_C0_43.2 |
Pentium_TSC |
| Pro,PII,PIII |
PPro_61 |
PPro_TSC |
| Pentium 4 |
P4_CYCLES |
P4_TSC |
| AMD |
|
|
| Athlon |
ATHLON_15 |
ATHLON_TSC |
| Hitachi |
|
|
| SR8000 |
SR8000_C6 |
special register |
|
Table 3.9:
Instructions (2)
| processor |
PCL_INTEGER_INSTR |
PCL_FP_INSTR |
| Alpha |
|
|
| 21164 |
21164_C1_9 |
21164_C1_103.3 |
| 21264 |
|
|
| MIPS |
|
|
| R10k |
|
R10k_C1_5 |
| R12k |
|
R12k_21 |
| SPARC |
|
|
| Ultra I/II |
|
|
| Ultra III |
|
ULTRA3_C0_24+ULTRA3_C1_39 |
| PowerPC |
|
|
| PPC604 |
PPC604_C0_14 |
PPC604_C0_15 |
| PPC604e |
PPC604e_C0_14 |
PPC604e_C0_15 |
| POWER3 |
POWER3_C5_2+POWER3_C6_1+POWER3_C7_4 |
POWER3_C1_35+POWER3_C4_5 |
| POWER3-II |
POWER3II_C5_2+POWER3II_C6_1+POWER3II_C7_4 |
POWER3II_C1_35+POWER3II_C4_5 |
| Intel |
|
|
| Pentium MMX |
|
Pentium_303.4 |
| Pro,PII,PIII |
|
PPro_C0_0 |
| Pentium 4 |
|
P4_CG4_14 |
| AMD |
|
|
| Athlon |
|
|
| Hitachi |
|
|
| SR8000 |
|
SR8000_C7 |
|
Table 3.10:
Instructions (1)
| processor |
PCL_LOAD_INSTR |
PCL_STORE_INSTR |
PCL_LOADSTORE_INSTR |
PCL_INSTR |
| Alpha |
|
|
|
|
| 21164 |
21164_C1_11 |
21164_C1_12 |
|
21164_C0_13.5 |
| 21264 |
|
|
|
AL264_0_1 |
| MIPS |
|
|
|
|
| R10k |
R10k_C1_2 |
R10k_C1_3 |
|
R10k_C0_15,R10k_C1_13.6 |
| R12k |
R12k_18 |
R12k_19 |
R12k_18+R12k_193.7 |
R12_15 |
| SPARC |
|
|
|
|
| Ultra I/II |
|
|
|
ULTRA_C0_1 |
| Ultra III |
|
|
|
ULTRA3_C0_1,ULTRA3_C1_1 |
| PowerPC |
|
|
|
|
| PPC604 |
PPC604_C1_18 |
|
|
PPC604_C0_2, PPC604_C1_2 |
| PPC604e |
PPC604e_C1_18 |
|
|
PPC604e_C0_2, PPC604e_C1_2, PPC604e_C2_2, PPC604e_C3_2 |
| POWER3 |
POWER3_C0_4,POWER3_C3_5 |
POWER3_C2_9 |
POWER3_C3_5+POWER3_C2_9 |
POWER3_C0_1,POWER3_C1_0,POWER3_C2_2,POWER3_C3_2 |
| POWER3-II |
POWER3II_C0_4,POWER3II_C3_5 |
POWER3II_C2_9 |
POWER3II_C3_5+POWER3II_C2_9 |
POWER3II_C0_1,POWER3II_C1_0,POWER3II_C2_2,POWER3II_C3_2 |
| Intel |
|
|
|
|
| Pentium MMX |
|
|
Pentium_36 |
Pentium_20 |
| Pro,PII,PIII |
|
|
PPro_0 |
PPro_44 |
| Pentium 4 |
P4_CG4_12 |
P4_CG4_12 |
P4_CG4_12 |
P4_CG4_18, 19 |
| AMD |
|
|
|
|
| Athlon |
|
|
|
ATHLON_28 |
| Hitachi |
|
|
|
|
| SR8000 |
|
|
SR8000_C4 |
SR8000_C5 |
|
Table 3.11:
Branch instructions
| processor |
PCL_JUMP_SUCCESS |
PCL_JUMP_UNSUCCESS |
PCL_JUMP |
| Alpha |
|
|
|
| 21164 |
|
21164_C2_2 |
|
| 21264 |
|
|
21264_C1_1 |
| MIPS |
|
|
|
| R10k |
R10k_C0_6-R10k_C1_8 |
R10k_C1_8 |
R10k_C0_6 |
| R12k |
R12k_6-R12k_24 |
R12k_24 |
R12k_6 |
| SPARC |
|
|
|
| Ultra I/II |
|
|
|
| Ultra III |
|
ULTRA3_C0_21+ULTRA3_C1_29 |
ULTRA3_C0_22 |
| PowerPC |
|
|
|
| PPC604 |
PPC604_C1_8-PPC604_C0_7 |
PPC604_C0_7 |
PPC604_C1_8 |
| PPC604e |
PPC604e_C1_8-PPC604e_C0_7 |
PPC604e_C0_7 |
PPC604e_C1_8 |
| POWER3 |
POWER3_C1_8 |
POWER3_C3_22-POWER3_C1_8 |
POWER3_C3_22 |
| POWER3-II |
POWER3II_C1_8 |
POWER3II_C3_22-POWER3II_C1_8 |
POWER3II_C3_22 |
| Intel |
|
|
|
| Pentium MMX |
Pentium_43.8 |
Penntium_16-Pentium_43.9 |
Pentium_16 |
| Pro,PII,PIII |
PPro_52 |
PPro_51 |
PPro_50 |
| Pentium 4 |
P4_CG4_2 |
P4_CG4_4 |
P4_CG4_4+P4_CG4_0, 2 |
| AMD |
|
|
|
| Athlon |
ATHLON_32 |
ATHLON_31 |
ATHLON_35 |
| Hitachi |
|
|
|
| SR8000 |
|
|
|
|
Table 3.12:
Atomic instructions
| processor |
PCL_ATOMIC_SUCCESS |
PCL_ATOMIC_UNSUCCESS |
PCL_ATOMIC |
| Alpha |
|
|
|
| 21164 |
21164_C2_13 |
|
|
| 21264 |
|
|
|
| MIPS |
|
|
|
| R10k |
R10k_C1_4-R10k_C0_5 |
R10k_C0_5 |
R10k_C1_4 |
| R12k |
R12k_20-R12k_5 |
R12k_5 |
R12k_20 |
| SPARC |
|
|
|
| Ultra I/II |
|
|
|
| Ultra III |
|
|
|
| PowerPC |
|
|
|
| PPC604 |
PPC604_C1_9 |
|
|
| PPC604e |
PPC604e_C1_9 |
|
|
| POWER3 |
|
POWER3_C1_13 |
|
| POWER3-II |
|
POWER3II_C1_13 |
|
| Intel |
|
|
|
| Pentium MMX |
|
|
|
| Pro,PII,PIII |
|
|
|
| Pentium 4 |
|
|
|
| AMD |
|
|
|
| Athlon |
|
|
|
| Hitachi |
|
|
|
| SR8000 |
|
|
|
|
Table 3.13:
Blocked units
| processor |
PCL_STALL_INTEGER |
PCL_STALL_FP |
PCL_STALL_JUMP |
PCL_STALL_LOAD |
PCL_STALL_STORE |
PCL_STALL |
| Alpha |
|
|
|
|
|
|
| 21164 |
|
|
|
|
|
|
| 21264 |
|
|
|
|
|
|
| MIPS |
|
|
|
|
|
|
| R10k |
|
|
|
|
|
|
| R12k |
|
|
|
|
|
|
| SPARC |
|
|
|
|
|
|
| Ultra I/II |
|
|
|
|
|
|
| Ultra III |
|
|
|
|
ULTRA3_C0_5 |
|
| PowerPC |
|
|
|
|
|
|
| PPC604 |
|
|
|
|
|
|
| PPC604e |
|
PPC604e_C2_19 |
PPC604e_C2_12 |
|
|
|
| POWER3 |
|
|
|
|
|
|
| POWER3-II |
|
|
|
|
|
|
| Intel |
|
|
|
|
|
|
| Pentium MMX |
|
Pentium_C0_53.10 |
|
Pentium_24 |
Pentium_23 |
|
| Pro,PII,PIII |
|
|
|
|
|
PPro_58 |
| Pentium 4 |
|
|
|
|
|
|
| AMD |
|
|
|
|
|
|
| Athlon |
|
ATHLON_49 |
|
|
|
|
| Hitachi |
|
|
|
|
|
|
| SR8000 |
|
|
|
|
|
|
|
Table 3.14:
Rates and Ratios
| processor |
PCL_MFLOPS |
PCL_IPC |
PCL_L1DCACHE_MISSRATE |
PCL_L2DCACHE_MISSRATE |
PCL_MEM_FP_RATIO |
| Alpha |
|
|
|
|
|
| 21164 |
21164_C1_10/21164_C2_11*Mhz |
21164_C0_1/21164_C2_11 |
21164_C2_5/21164_C1_14 |
21164_C2_14/21164_C1_153.11 |
|
| 21264 |
|
|
|
|
|
| MIPS |
|
|
|
|
|
| R10k |
R10k_C1_5/R10k_C0_0*Mhz |
R10k_C0_15/R10k_C1_0 |
|
|
|
| R12k |
R12k_21/R12k_0*Mhz |
|
|
|
|
| SPARC |
|
|
|
|
|
| Ultra I/II |
|
ULTRA_C0_1/ULTRA_C1_0 |
|
ULTRA_C1_9/ULTRA_C0_11 |
|
| Ultra III |
(ULTRA_C0_24+ULTRA_C1_39)/MHz |
ULTRA_C0_1/ULTRA_C1_1 |
|
ULTRA_C1_12/ULTRA_C0_12 |
|
| PowerPC |
|
|
|
|
|
| PPC604 |
PPC604_C0_15/PPC604_C1_1*Mhz |
PPC604_C0_2/PPC604_C1_1 |
|
|
|
| PPC604e |
PPC604e_C0_15/PPC604e_C1_1*Mhz |
PPC604e_C0_2/PPC604e_C1_1 |
|
|
|
| POWER3 |
POWER3_C1_35/POWER3_C4_5*Mhz |
POWER3_C0_1/POWER3_C1_1 |
|
|
|
| POWER3-II |
POWER3II_C1_35/POWER3II_C4_5*Mhz |
POWER3II_C0_1/POWER3II_C1_1 |
|
|
|
| Intel |
|
|
|
|
|
| Pentium MMX |
Pentium_30/Pentium_C0_4*Mhz |
Pentium_20/Pentium_C0_4 |
Pentium_37/Pentium_36 |
|
Pentium_36/Pentium_30 |
| Pro,PII,PIII |
PPro_C0_0/PPro_61*Mhz |
PPro_44/PPro_61 |
PPro_1/PPro_0 |
|
P4_CG4_12/P4_CG4_14 |
| Pentium 4 |
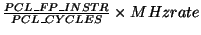
P4_CG4_14/P4_CYCLES*MHz |
P4_CG4_18, 19/P4_CYCLES |
|
P4_CG1_13/P4_CG1_10,11,12,13 |
|
| AMD |
|
|
|
|
|
| Athlon |
|
ATHLON_28/ATHLON_15 |
ATHLON_3/ATHLON_2 |
|
|
| Hitachi |
|
|
|
|
|
| SR8000 |
|
|
|
|
|
|
Interface Functions
The interface functions to control the performance counters are given
below. All functions are callable from C, C++, Fortran, and Java. All
functions return status codes with the following meaning:
- PCL_SUCCESS
- function successful finished
- PCL_NOT_SUPPORTED
- requested event is not supported on this hardware
- PCL_TOO_MANY_EVENTS
- more events requested than performance
counters are available
- PCL_TOO_MANY_NESTINGS
- there are more nested calls than allowed
(PCL_MAX_NESTING_LEVEL )
- PCL_TOO_ILL_NESTING
- either a different number or different
types of events are requested in nested calls
- PCL_ILL_EVENT
- event identifier illegal
- PCL_MODE_NOT_SUPPORTED
- performance counting for that mode
is not supported
- PCL_FAILURE
- failure for some unspecified reason
Every PCL call needs a handle (denoted by descr) to work in a
multi-threaded environment. Such a handle needs to be allocated once
with a call to PCLinit before any other PCL function is
called. A handle should be deallocated with PCLexit after all
PCL functions were called.
The high-level interface is the usual interface as it allows a
portable access to performance counters.
Allocates a thread-specific descriptor which must be passed to all
subsequent PCL calls. The address of a descriptor must be passed.
int PCLinit(
             PCL_DESCR_TYPE* addr_descr   /* I/O: addr of handle */
           );
Releases the thread-specific descriptor.
int PCLexit(
             PCL_DESCR_TYPE  & descr      /* I: handle */
           );
With this function, queries are done if a certain functionality is
available on this machine. The user supplies in counter_list an
array of size ncounter of event names (of type integers). Event
names are any of those introduced in the tables 3.1 to
3.13 in the last section. In mode, the user specifies
the execution mode for which performance data should be gathered: PCL_MODE_USER specifies counting in user mode, PCL_MODE_SYSTEM specifies counting in system mode, and PCL_MODE_USER_SYSTEM specifies either of both modes. The function
returns PCL_SUCCESS if the requested functionality is possible
(i.e. if the requested events can be counted in parallel), otherwise
an error code is returned why the requested events are not supported
on this system. No resources are allocated on this call.
int PCLquery(
              PCL_DESCR_TYPE & descr,  /* I: handle */
              int *counter_list,       /* I: requested event counters */
              int ncounter,            /* I: number of counters */
              unsigned int mode        /* I: mode flags (PCL_MODE_xxx) */
            );
With PCLstart, performance counting is started (if it is
possible). The user supplies in counter_list an array of size
ncounter of event names. Event names are any of those
introduced in the tables 3.1 to 3.13 in the last
section. mode has the same meaning as in the description of PCLquery. If the requested functionality is available, the
appropriate performance counters are cleared and started. On success,
PCL_SUCCESS is returned, otherwise an error code is returned.
int PCLstart(
             PCL_DESCR_TYPE descr,   /* I: handle */
             int *counter_list,      /* I: events to be counted */
             int ncounter,           /* I: number of counters */
             unsigned int mode       /* I: mode flags (PCL_MODE_xxx) */
            );
Reads out performance counters and returns counter values. Each of the
the result values is either written into the (user supplied)
integer-typed buffer i_results_list or into the (user
supplied) floating point typed buffer fp_results_list both of
size ncounter. PCL_CNT_TYPE is a 64-bit integer type,
PCL_FP_CNT_TYPE is a 64-bit floating point type. Which of the
buffers is used for the i-th result depends on the requested i-th
event type. If the i-th event type is less than PCL_MFLOPS, the
result is an integer value which is stored in i_results_list[i]. If the i-th event type is greater than or equal
to PCL_MFLOPS (i.e. belongs to the category rates and ratios),
the result is a floating point value stored in fp_results_list[i]. If the i-th result is stored in i_results_list[i], the content of fp_results_list[i] is
undefined, and the same holds for the other way.
The arguments supplied with the call to PCLread must correspond
to the latest call to PCLstart, i.e. the number of requested
performance counters must be equal. If no error occurs, PCL_SUCCESS is returned, otherwise an error code. The performance
counters are (logically) not stopped.
int PCLread(
            PCL_DESCR_TYPE descr,             /* I: handle */
            PCL_CNT_TYPE *i_result_list,      /* O: int counter values */
            PCL_FP_CNT_TYPE * fp_result_list, /* O: fp counter values */
            int ncounter                      /* I: number of events */
            );
Stops performance counting and returns counter values. Result values
are written into the (user supplied) buffers i_result_list or
fp_result_list both of size ncounter. See PCLread
for a description how the results are stored in the two arrays. The
arguments supplied with the call to PCLstop must correspond to
the latest call to PCLstart, i.e. the number of requested
performance counters must be equal. If no error occurs, PCL_SUCCESS is returned, otherwise an error code.
int PCLstop(
            PCL_DESCR_TYPE descr,              /* I: handle */
            PCL_CNT_TYPE *i_result_list,       /* O: int counter values */
            PCL_FP_CNT_TYPE * fp_result_list,  /* O: fp counter values */
            int ncounter                       /* I: number of events */
           );
The low-level interface should only be used in rare circumstances. It
allows a direct access to hardware performance counters in a uniform
way. The user has to be aware of events and events codings for the
processor in use. This is different to the high-level interface where
an abstract layer exists which hides all low-level and non-portable
details. The low-level interface is only accessible from C/C++.
The low-level interface was introduced in version 2.0 and feedback on
its design and usage is welcome. The interface may change in the
future.
Before using any of the driver functions, a handle need to be
allocated by a call to PCLinit(PCL_DESCR_TYPE
*descr). After using the driver routines, a call to PCLexit(PCL_DESCR_TYPE descr) must be issued to release the
handle.
This function returns information on the processor in use. The
function returns PCL_SUCCESS if the operation didn't produce
any error.
int PCL_driver_open(
                    PCL_PROCESSOR_INFO *info /* I: address of info struct */
                    );
The type PCL_PROCESSOR_INFO is a struct with at least the
following components:
typedef struct
{
    char *vendor;   /* processor vendor */
    char *family;   /* processor family */
    char *model;    /* processor model */
    int mhz;        /* MHz rate */
    int ncounters;  /* number of counters (at least this number) */
}  PCL_PROCESSOR_INFO;
This function has to be called once and before any other driver call
to open the hardware driver interface. The function returns PCL_SUCCESS if the operation could be successfully done.
int PCL_driver_open(
                     PCL_DESCR_TYPE descr /* I: handle */
                   );
Starts performance counting. max_counter specifies the maximum
counter index (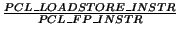 PCL_COUNTER_MAX). counter_used_mask is
a bit field where the bits 0-max_counter speciy which counters
should be started. E.g. if you want to measure counter 0,3, and 4 you
may pass 4 or higher for max_counter and a bit field which has
at bit position 0, 3, and 4 a 1 and otherwise a 0 (starting bit
counting with 0) . If no error occurs, PCL_SUCCESS is returned,
otherwise an error code.
PCL_COUNTER_MAX). counter_used_mask is
a bit field where the bits 0-max_counter speciy which counters
should be started. E.g. if you want to measure counter 0,3, and 4 you
may pass 4 or higher for max_counter and a bit field which has
at bit position 0, 3, and 4 a 1 and otherwise a 0 (starting bit
counting with 0) . If no error occurs, PCL_SUCCESS is returned,
otherwise an error code.
int PCL_driver_start(
        PCL_DESCR_TYPE descr                 /* I: handle */
        int max_counter,                     /* I: max. counter index */
        PCL_BIT_MASK_TYPE counter_used_mask, /* I: bit-field of counters to use */
        PCL_DRIVER_COMMAND_TYPE *commands,   /* I: event commands for counters */
        unsigned int count_mode              /* I: count mode */
        );
Reads out performance counters. The read values are returned in counter_values, a user-supplied buffer capable of storing max_counter values. max_counter specifies the maximum counter
index ( PCL_COUNTER_MAX). counter_used_mask gives in a
bit field the hardware counters which should be read. If no error
occurs, PCL_SUCCESS is returned, otherwise an error code.
int PCL_driver_read(
   PCL_DESCR_TYPE descr     /* I: handle */
   int max_counter,         /* I: max. counter index */
   PCL_BIT_MASK_TYPE counter_used_mask,  /* I: bit-field of counters to be read */
   PCL_CNT_TYPE *counter_values     /* I/O: buffer for results */
   );
Stops performance counting. If no error occurs, PCL_SUCCESS
is returned, otherwise an error code.
int PCL_driver_stop(
      PCL_DESCR_TYPE descr   /* I: handle */
      );
Closes the driver and releases all allocated ressources. If no error
occurs, PCL_SUCCESS is returned, otherwise an error code.
int PCL_driver_close(
         PCL_DESCR_TYPE descr /* I: handle */
        );
There are two macros defined:
- PCL_EVENT_IS_INT(e) determines whether the result of an
event e is of type integer (64 bits) or has a floating point type (64
bits)
- PCL_EVENT_IS_RATE(e) determines whether the result for an
event means and event count or an event rate (counts may be added,
adding rates makes less sense)
The allowed calling sequence is one call to PCLstart followed
by zero or more calls to PCLread followed by one call to PCLstop. Between a call to PCLstart and PCLstop
(and possible calls to PCLread) may be nested calls to other
allowed calling sequences with the same number of events and the same
event types.
On system with virtual (low level) performance counters, migrating a
process to another processor is possible (SGI, AIX). On the other
systems, we bind the executing process to a processor (DEC,
SOLARIS)3.11, or the process can not migrate
(CRAY). On Solaris systems, if the process is not bound to a specific
processor, the process gets bound to the processor 0 when executing
the PCLstart function. On DEC systems, the process gets bound to
the processor the process is currently running on. If you use pthreads
on Solaris systems, you must bind each thread to a processor.
Currently, performance counters are not saved on context switches on
Linux systems by our library and therefore performance measurements
should be done only on a lightly loaded system.
Currently, we do not check if any other process uses the performance
counters as well3.12. Therefore, on certain systems if two distinct processes
use performance counters in parallel, they may disturb each other.
To avoid overflow e.g. on systems with 32-bit hardware counters, an
interval timer is called on these systems (Solaris, AIX, Linux)
which interrupts the process every second. Programs which use the setitimer system call (or the SIGVTALRM signal), may be in
conflict with PCL.
Currently, the Performance Counter Library is available on the systems listed
above:
- Alpha 21164 on Digital Unix 4.0x
- Alpha 21264 on Digital Unix
 4.0e
4.0e
- Alpha 21164 on CRAY T3E Unicos/mk
- R10000,R12000 on SGI IRIX 6.x
- UltraSPARC I/II/III on Solaris 2.x and above
- PowerPC 604,604e,POWER3,POWER3-II in AIX 4.3
- Pentium/PPro/Pentium II/Pentium III, Pentium 4 on Linux 2.x.x
- AMD Athlon
Below is a simple example program how to use the Performance Counter
Library. First, the list of requested events (PCL_LOAD_INSTR
for load instructions, and PCL_L1DCACHE_MISS for 1st level
data cache misses) is put into the array counter_list. With the
call to PCLquery we test, if it is possible to serve these two
requested events simultaneously on the computer system where the
program is executed. If this is possible, event counting is started
with the call to PCLstart. After that follows the code to be
measured and a call to PCLstop to stop performance counting and
to read out the performance counter values. Then, the results are
printed.
#include <pcl.h>

void do_work(){}

int main(int argc, char **argv)
{
    int counter_list[2];
    int ncounter;
    unsigned int mode;
    PCL_CNT_TYPE i_result_list[2];
    PCL_FP_CNT_TYPE fp_result_list[2];
    PCL_DESCR_TYPE descr;


    /* Allocate a handle */
    if(PCLinit(&descr) != PCL_SUCCESS)
        printf("cannot get handle\n");

    /* Define what we want to measure. */
    ncounter = 2;
    counter_list[0] = PCL_CYCLES;
    counter_list[1] = PCL_INSTR;

    /* define count mode */
    mode = PCL_MODE_USER;

    /* Check if this is possible on the machine. */
    if(PCLquery(descr, counter_list, ncounter, mode) != PCL_SUCCESS)
        printf("requested events not possible\n");

    /* Start performance counting.
       We have checked already the requested functionality
       with PCL_query, so no error check would be necessary. */
    if(PCLstart(descr, counter_list, ncounter, mode) != PCL_SUCCESS)
        printf("something went wrong\n");

    /* Here comes the work to be measured. */
    do_work();

    /* Stop performance counting and get the counter values. */
    if(PCLstop(descr, i_result_list, fp_result_list, ncounter) != PCL_SUCCESS)
        printf("problems with stopping counters\n");

    /* print out results */
    printf("%f instructions in %f cycles\n",
           (double)i_result_list[1], (double)i_result_list[0]);

    /* Deallocate handle */
    if(PCLexit(descr) != PCL_SUCCESS)
        printf("cannot release handle\n");

    return 0;
}
Below is an example how to use nested calls. In this example, for the
outer loop as well as for each iteration the number of cycles spent in
this code section is measured.
#include <pcl.h>

#define NITER 4

void do_work(){}

int main(int argc, char **argv)
{
    int counter_list[1];
    int ncounter, res, iter;
    unsigned int mode;
    PCL_CNT_TYPE i_all_result_list, i_result_list[NITER];
    PCL_FP_CNT_TYPE fp_all_result_list, fp_result_list[NITER];
    PCL_DESCR_TYPE descr;


    /* Allocate a handle */
    if(PCLinit(&descr) != PCL_SUCCESS)
        printf("cannot get handle\n");

    /* Define what we want to measure. */
    ncounter = 1;
    counter_list[0] = PCL_CYCLES;

    /* define count mode */
    mode = PCL_MODE_USER;

    /* Start performance counting. */
    res = PCLstart(descr,counter_list, ncounter, mode);

    for(iter = 0; iter < NITER; ++iter)
      {
        /* Start performance counting. */
        res = PCLstart(descr, counter_list, ncounter, mode);

        /* Here comes the work to be measured. */
        do_work();

        /* Stop performance counting and get counter values. */
        res = PCLstop(descr, &i_result_list[iter], &fp_result_list[iter], ncounter);
      }

    /* Stop performance counting and get the counter values. */
    res = PCLstop(descr, &i_all_result_list, &fp_all_result_list, ncounter);

    /* print out results */
    printf("used cycles: %f %f %f %f, total: %f\n",
           (double)i_result_list[0], (double)i_result_list[1],
           (double)i_result_list[2], (double)i_result_list[3],
           (double)i_all_result_list);

    /* Deallocate handle */
    if(PCLexit(descr) != PCL_SUCCESS)
        printf("cannot release handle\n");

    return 0;
}
Below is an example how to use PCL in Java.
public class pcl_jtest {
  static final int N = 200;               // matrix dimension
  static double[][] a = new double[N][N];
  static double[][] b = new double[N][N];
  static double[][] c = new double[N][N];

  // test method
  static void matadd(double[][] a, double[][] b, double[][] c) {
    int i, j;
    for (i = 0; i < N; ++i)
      for (j = 0; j < N; ++j)
        a[i][j] = b[i][j] + c[i][j];
  }

  // main program
  public static void main(String[] args) {
    int event;
    long descr = 0;                      // descriptor
    PCL pcl = new PCL();                 // instantiate PCL
    int mode = pcl.PCL_MODE_USER_SYSTEM; // count mode
    int[] events = new int[1];           // events; array required
    long[] i_result = new long[1];       // int results; array required
    double[] fp_result = new double[1];  // fp results


    if(pcl.PCLinit(descr) != pcl.PCL_SUCCESS)
      System.out.println("problem with init");

    // test supported events
    for(event = 0; event < pcl.PCL_MAX_EVENT; ++event) {
        events[0] = event;
        if(pcl.PCLquery(descr, events, 1, mode) == pcl.PCL_SUCCESS) {
            // start counting
            if(pcl.PCLstart(descr, events,1,mode) != pcl.PCL_SUCCESS)
                System.out.println("problem with starting event");

            // test program
            matadd(a,b,c);

            // stop counting
            if(pcl.PCLstop(descr,i_result,fp_result,1) != pcl.PCL_SUCCESS)
                System.out.println("problem with stopping event");

            // print result for event i
            if(event < pcl.PCL_MFLOPS)
              // integer result
              System.out.println(pcl.PCLeventname(event)+":"+i_result[0]);
            else
              // floating point result
              System.out.println(pcl.PCLeventname(event)+":"+fp_result[0]);
          }
      }

    if(pcl.PCLexit(descr) != pcl.PCL_SUCCESS)
      System.out.println("problem with exit");
   }
}
Below is an example how to use low-level interface.
#include <pcl.h>

void do_work(){}

int main(int argc, char **argv)
{
    int res, counter_index;
    unsigned int count_mode;
    PCL_DESCR_TYPE descr;
    PCL_PROCESSOR_INFO info;
    PCL_BIT_MASK_TYPE counter_used_mask;
    PCL_DRIVER_COMMAND_TYPE commands[PCL_COUNTER_MAX];
    PCL_CNT_TYPE counter_values[PCL_COUNTER_MAX];


    /* Allocate a handle */
    if(PCLinit(&descr) != PCL_SUCCESS)
        printf("cannot get handle\n");

    /* get processor info */
    if((res = PCL_driver_info(&info)) != PCL_SUCCESS)
      printf("error on PCL_driver_info (%d)\n", res);
    else
      {
        printf("processor vendor  : %s\n", info.vendor);
        printf("processor family  : %s\n", info.family);
        printf("processor model   : %s\n", info.model);
        printf("processor speed   : %d MHz\n", info.mhz);
        printf("number of counters: >=%d\n", info.ncounters);
      }

    /* open driver */
    if((res = PCL_driver_open(descr)) != PCL_SUCCESS)
      printf("error on PCL_driver_open (%d)\n", res);

    /* This is for a DEC Alpha 21164: count FP operations */
    counter_index = 1;
    commands[counter_index] = 0x0a;

    counter_used_mask = (0x1 << counter_index);
    count_mode = PCL_MODE_USER;
    if((res = PCL_driver_start(descr, PCL_COUNTER_MAX, counter_used_mask,
			       commands, count_mode)) != PCL_SUCCESS)
      printf("error on PCL_driver_start (%d)\n", res);

    /* do some work */
    do_work();

    /* read counter */
    if((res = PCL_driver_read(descr, PCL_COUNTER_MAX, counter_used_mask,
			      counter_values)) != PCL_SUCCESS)
      printf("error on PCL_driver_read (%d)\n", res);
    else
      printf("%.0f floating point instructions\n",
	     (double)counter_values[counter_index]);

    /* stop counting */
    if((res = PCL_driver_stop(descr)) != PCL_SUCCESS)
      printf("error on PCL_driver_stop (%d)\n", res);

    /* close driver */
    if((res = PCL_driver_close(descr)) != PCL_SUCCESS)
      printf("error on PCL_driver_close (%d)\n", res);

    /* deallocate handle */
    if(PCLexit(descr) != PCL_SUCCESS)
        printf("cannot release handle\n");

    return 0;
}
In the Parallel Tools Consortium there is a subproject defined called
PAPI. Its main aspect is to define an API to access all system
specific hardware performance counters, i.e. to start/read out/stop
all hardware performance counters on a microprocessor with all events
available on that system. This is a different approach than ours as we
focus on a single framework on all systems, i.e. a uniform application
interface as well as a well-defined set of events accessible with
uniform names on all systems. For the PerfAPI project, have a look at
http://www.cs.utk.edu/~mucci/pdsa/.
There are a lot of interfaces to access performance counters on one
specific system, e.g. libperfex on SGI systems with the
R10000-processor or the pfm-device on Digital Unix systems
(21064 or 21164 processors). To establish a common platform for
performance counting on all POWER and PowerPC microprocessors, IBM has
defined an application interface called
PMapi.
Their approach is as well, to define the set of possible events as the
union of all possible events on all POWER and PowerPC microprocessors.
On Linux systems,
libpperf
supports all Pentium, PentiumPro, and Pentium II processors through a
common interface.
PCL - the Performance Counter Library - is a common interface for
portable performance counting on modern microprocessors. It is
intended to be used by the expert application programmer who wishes to
do detailed analysis on program performance, and it is intended to be
used by tool writers who need a common platform to base their work
on.
The application interface supports query for functionality, start and
stop of performance counting and reading out the values of the
performance counters. Nested calls to the functions are possible (with
the same events) therefore allowing to do hierarchical performance
measurements on sections and subsections of a program. Further,
performance counting in user mode, system, and user-or-system mode can
be distinguished. Language bindings are available for C, C++, Fortran,
and Java.
PCL is available at
and
.
We would like to thank those hardware vendors who supported us with
detailled information on performance counters, access to test systems,
and/or test hardware. Namely Cray, Hitachi, IBM, Intel, and SGI.
Additionally, we would like to thank those people who have written
software we based our work on. For the current PCL version this is
perfctr
from Mikael Pettersson.
For older PCL versions, we would like to thank
Richard Enbody
for
perfmon
on UltraSPARC-systems, and M. Patrick Goda and Michael S. Warren for
libpperf
which itself is based on the
msr
device implemented
by Stephan Meyer on Linux version 2.0.x, 2.1.x, and 2.2.x.
- 1
-
Kirk W. Cameron and Yong Luo.
Performance evaluation using hardware performance counters.
http://www.c3.lanl.gov/ kirk/isca99/.
- 2
-
Digital Equipment Corporation, Maynard, Massachusetts.
man 7 pfm.
- 3
-
Digital Equipment Corporation, Maynard, Massachusetts.
Alpha AXP Architecture Handbook, version 2 edition, 1994.
- 4
-
Silicon Graphics Inc.
man libperfex.
- 5
-
MIPS Technologies Inc., Mountain View, California.
Definition of MIPS R12000 Performance-counter.
- 6
-
Marco Zagha and et.al.
Performance Analysis using the MIPS R10000 Performance
Counters.
In Supercomputing 96. IEEE Computer Society, 1996.
- 7
-
Sun Microsystems, Palo Alto, California.
UtraSPARC User's Manual, 1997.
- 8
-
SPARC International, Inc.
The SPARC Architecture Manual, Version 9, 1997.
- 9
-
Motorala Inc., IBM.
The PowerPC Family : The Bus Interface for 32-Bit
Microprocessors, 3 1997.
- 10
-
James E. Smith Shlomo Weiss.
POWER and PowerPC.
Morgan Kaufmann Publishers, Inc., 1994.
- 11
-
Motorola Inc., IBM.
PowerPC 604e RISC Microprocessor User's Manual, 3 1998.
- 12
-
http://developer.intel.com/drg/mmx/AppNotes/perfmon.htm.
- 13
-
Intel Corp.
Pentium Pro Family Developers Manual 1-3, 1997.
- 14
-
Intel.
Intel IA-64 Architecture Software Developer's Manual, volume 4.
January 2000.
Performance Counters on Microprocessors
This chapter introduces performance counting aspects of commonly used
microprocessors. Each section introduces a microprocessor family and
is divided into three subsections: base information on the
microprocessor, performance counter events sorted by each performance
counter, and in the third subsection additional comments and
references to existing implementations to access the performance
counters on that specific microprocessor. The second part of each
section, the description of the performance counters and their events,
is given for each event as follows. The first line contains an event
identifier which is composed of the name of the microprocessor
(e.g. 21164 for the Alpha 21164), the number of the performance
counter (e.g. C0 for counter 0), and a number giving the event
number. We will refer to the whole name as a unique identifier in all
chapters. The next line contains a manufacturer-specific name or
definition (in italics) of the event as found in the manufacturer's
literature. After that, a description of the event follows.
To use performance counters on DEC Alpha microprocessors, additional
software support is necessary as the low-level interface is given in
PAL-Code. Tru64 (formely Digital Unix) has the pseudo device pfm [2] which has a high-level interface based on ioctl-calls to access the performance counters. The pfm-device
on systems distinguishes between user and system mode event
counting. Only one process per CPU can open the device, but child
processes can be spawned which influence the performance counters as
well.
On the CRAY T3E, which uses the 21164 microprocessor too, there is no
software interface published to access the performance counters.
The RISC-processor DEC Alpha 21164
has 3 performance counters. First, let's have a closer look at the
architecture of the microprocessor. The first level of caches contain
an instruction (ICACHE) and a data cache (DCACHE), each
having a size of 8 KB. The second level cache (SCACHE) has a
size of 96 KB buffering instructions and data. An additional option is
an external third level cache (BCACHE). A detailed description of the
Alpha architecture can be found in [3].
The 21164 contains pipelines of the following types:
- 7-stage integer pipelines
- 9-stage floating point pipelines
- 13-stage memory reference pipeline
The performance counter part on the DEC Alpha 21164 contains 3
counters with distinct purposes. Roughly speaking, counter 0 counts
machine cycles or issued instructions, counter 1 counts successful
operations, and counter 2 counts unsuccessful operations. For the
counters, 2, 24, and 23 different events are defined, respectively,
and the counters can operate in parallel. There is one restriction
that when counting certain events on counter 2, counter 1 gathers
special events. The counters are 16 bit (counter 0,1) and 14 bit
(counter 2) wide. The cycle counter is 64 bit wide, but only the lower
32 bits contain cycle values, the upper 32 bit are OS specific.
Events countable on the DEC Alpha 21164 are:
- Processor Cycle Counter:
- 21164_PCC
elapsed machine cycles
- Counter 0:
- 21164_C0_0
CYCLES
machine cycles
- 21164_C0_1
ISSUES
issued instructions
- Counter 1:
- 21164_C1_0
NON_ISSUE_CYCLES
Either no instructions have been issued to the pipeline in the number of
cycles, or the pipeline has been stalled for that number of cycles.
- 21164_C1_1
SPLIT_ISSUE_CYCLES
Not all startable instructions have been included into the instruction pipeline.
- 21164_C1_2
PIPELINE_DRY
A parallel execution of instructions was not possible.
- 21164_C1_3
REPLAY_TRAP
If a started instruction could not be further processed, the instruction is
issued again in the instruction pipeline, which is called a replay trap.
- 21164_C1_4
SINGLE_ISSUE_CYCLES
Exactly 1 instruction was issued in a cycle.
- 21164_C1_5
DUAL_ISSUE_CYCLES
Exactly 2 instructions were issued in a cycle.
- 21164_C1_6
TRIPLE_ISSUE_CYCLES
Exactly 3 instructions were issued in a cycle.
- 21164_C1_7
QUAD_ISSUE_CYCLES
Exactly 4 instructions were issued in a cycle.
- 21164_C1_8
FLOW_CHANGE
A jump instruction was executed. Conditional and unconditional jumps are
distinguished.
Remark:
- If counter 3 counts branch-mispredictions, then branches are counted.
- If counter 3 counts pc-mispredictions, then jsr (subroutine calls, returns)
are counted.
- 21164_C1_9
INTEGER_OPERATE
Executed operations in the integer pipelines.
- 21164_C1_10
FP_INSTRUCTIONS
Executed operations in the floating point pipelines.
- 21164_C1_11
LOAD_INSTRUCTIONS
Executed load instructions.
- 21164_C1_12
STORE_INSTRUCTIONS
Executes store instructions.
- 21164_C1_13
ICACHE_ACCESS
Accesses to the 1st level instruction cache (ICACHE).
- 21164_C1_14
DCACHE_ACCESS
Accesses to the 1st level data cache (DCACHE).
- 21164_C1_15-21164_C1_21
''CBOX1''
Accesses to 2nd or 3rd level cache. There need to be defined additional
options [3]:
- 21164_C1_15
SCACHE_ACCESS
Accesses to 2nd level cache (SCACHE).
- 21164_C1_16
SCACHE_READ
Read accesses to 2nd level cache (SCACHE).
- 21164_C1_17
SCACHE_WRITE
Write accesses to 2nd level cache (SCACHE).
- 21164_C1_18
SCACHE_VICTIM
Number of non-completed memory frees in 2nd level cache (SCACHE).
- 21164_C1_19
BCACHE_HIT
Hits in 3rd level cache (BCACHE).
- 21164_C1_20
BCACHE_VICTIM
Number of non-completed memory frees in 3rd level cache (SCACHE).
- 21164_C1_21
SYS_REQ
Requests of additional hardware (multiprocessor system).
- Counter 2:
- 21164_C2_0
LONG_STALLS
Number of events that instruction pipeline was blocked for more than 12 cycles.
- 21164_C2_1
PC_MISPR
Program counter mispredictions.
- 21164_C2_2
BRANCH_MISPREDICTS
Branch mispredictions.
- 21164_C2_3
ICACHE_MISSES
Misses in the 1st level instruction cache (ICACHE).
- 21164_C2_4
ITB_MISSES
Misses in instruction TLB.
- 21164_C2_5
DCACHE_MISSES
Misses in 1nd level data cache (DCACHE).
- 21164_C2_6
DTB_MISS
Misses in data TLB.
- 21164_C2_7
LOADS_MERGED
An entry in the Miss-Address-File corresponds to a memory request.
- 21164_C2_8
LDU_REPLAYS
A replay trap was triggered by a missed load operation.
- 21164_C2_9
WB_MAF_FULL_REPLAYS
A replay trap was triggered by a missed write-back operation or by an
inconsistency in the miss-address-file.
- 21164_C2_10
EXTERNAL
A signal change at the pin ''perf_mon_h'' occurred.
- 21164_C2_11
CYCLES
Number of cycles.
- 21164_C2_12
MEM_BARRIER
Executed memory barrier instructions.
- 21164_C2_13
LOAD_LOCKED
A locked load instruction was executed.
- 21164_C2_14-21164_C2_21
''CBOX2''
Accesses to 2nd or 3rd level cache. There need to be defined additional
options [3]:
- 21164_C2_14
SCACHE_MISS
Misses on 2nd level cache.
- 21164_C2_15
SCACHE_READ_MISS
Read misses on 2nd level cache.
- 21164_C2_16
SCACHE_WRITE_MISS
Write misses on 2nd level cache.
- 21164_C2_17
SCACHE_SH_WRITE
Number of write-operations which go to caches other than the
processor-specific 2nd level cache.
- 21164_C2_18
SCACHE_WRITE
Write accesses to 2nd level cache.
- 21164_C2_19
BCACHE_MISS
Misses in 3rd level cache.
- 21164_C2_20
SYS_INV
Requests of additional hardware to invalidate a cache line (multiprocessor).
- 21164_C2_21
SYS_READ_REQ
Requests of additional hardware to read-copy a cache line (multiprocessor).
The DEC Alpha 21264 is a four-way out-of-order-issue microprocessor
that performs dynamic scheduling, register renaming, and speculative
execution. There are 4 integer execution units and 2 floating-point
execution units. The processor includes a 64 KB 1st level instruction
cache and a 64 KB 1st level data cache. The 21264 has 2 performance
counters of 20 bit width each. Counters 0 is capable of counting one
of 2 different events, and counter 1 is capable of counting one of 7
different events. Therefore, the ability to do a detailled performance
analysis on the 21264 is significantly reduced compared to the 21164.
Events countable on the DEC Alpha 21264 are:
- Processor Cycle Counter:
- 21264_PCC
elapsed machine cycles
- Counter 0:
- AL264_0_0
machine cycles
- AL264_0_1
retired instructions
- Counter 1:
- 21264_C1_0
machine cycles
- 21264_C1_1
retired conditional branches
- 21264_C1_2
retired branch mispredicts
- 21264_C1_3
retired DTB single misses * 2
- 21264_C1_4
retired DTB double double misses
- 21264_C1_5
retired ITB misses
- 21264_C1_6
retired unaligned traps
- 21264_C1_7
replay traps
The microprocessors R10000
and
R12000
of MIPS are 64 Bit RISC-microprocessors with integrated performance
counters.
Software support for the performance counters on R10000 processors is
available either on a lower level in IRIX 6.x through the /proc
file system or on a higher level through the perfex library
[4]. The kernel maintains data structures for 32 virtual
performance counters with a size of 64 bits each. It is possible to
distinguish between counting in user mode, system mode, or both. When
running in user mode, performance counters are saved on context
switches. For the perfex library, the routine start_counters zeroes out the internal counters, and read_counters stops the counters after reading them.
The R10000 processor has 64 physical registers and 32 logical
registers. The 1st level cache is split between a data cache and an
instruction cache, both of size 32 KB. The 2nd level cache can be
between 512 KB and 16 MB and the cache is a unified buffer at it
caches data as well as instructions. The main memory can be up to 1
TB.
The R10000 microprocessor has 2 performance counters (a description
can be found at
http://www.sgi.com/processors/r10k/performance.html) each capable of
counting one of 16 different events. The hardware counters are 32 bit
wide. The R10000 has 5 execution pipelines executing decoded
instructions. There are 2 integer pipelines (ALU1, ALU2), 2
floating point pipelines (FPU1, FPU2), and 1 address pipeline
(LOAD/STORE). The integer and floating point pipelines can
operate in parallel. For a better understanding we define the two
following terms:
- issued: An instruction was decoded and supplied to the executing
unit.
- graduated: An execution of an instruction has finished and all
instruction issued before the instruction have finished, too.
Another term to be defined is SCTP-Logic which is the Secondary
Cache Transaction Processing Logic, which has the task to store up to
4 internally generated or 1 externally generated 2nd level cache
transactions.
- Counter 0:
- R10k_C0_0
Cycles
Machine cycles.
- R10k_C0_1
Instructions issued
The counter is incremented with the sum of the following events:
- integer operations completed at this cycle. There can be 0-2 operations
each cycle.
- floating-point-operations completed at this cycle. There can be 0-2
operations each cycle.
- load/store operations which have been delivered in the last cycle to the
address pipeline. There can be 0 or 1 each cycle.
- R10k_C0_2
Load/prefetch/sync/CacheOp issued
Each of these instructions is counted when started.
- R10k_C0_3
Stores(including store-conditional) issued
Each time a store operations is delivered to the address calculation unit, the
counter is incremented.
- R10k_C0_4
Store conditional issued
Each time a conditional store operations is delivered to the address
calculation unit, the counter is incremented.
- R10k_C0_5
Failed store conditional
The counter is incremented each time a conditional store failed.
- R10k_C0_6
Conditional Branch resolved
Count all resolved conditional branches.
- R10k_C0_7
Quadwords written back from secondary cache
Counter is incremented each time a quad-word is written from the 2nd level
cache to the output buffer.
- R10k_C0_8
Correctable ECC errors on secondary cache data
A correctable 1-bit ECC error occurred while reading a quadword from the 2nd
level cache.
- R10k_C0_9
Instruction cache misses
Misses in the instruction cache.
- R10k_C0_10
Secondary cache misses (instruction)
Instruction misses in the 2nd level cache.
- R10k_C0_11
Secondary cache way mispredicted (instruction)
An attempt was made to load an instruction from the 2nd level cache and the
entry is marked as invalid.
- R10k_C0_12
External intervention requests
Number of requests to the SCTP-Logic from outside of the processor (I/O
devices, multiprocessor etc.) for a copy of a cache line marked as shared.
- R10k_C0_13
External invalidate requests
Number of requests to the SCTP-Logic from outside of the processor (I/O
devices, multiprocessor etc.) for invalidation of a cache line marked.
- R10k_C0_14
Functional unit completion cycles
The counter is incremented if at least one of the functional units has
completed an operations in this cycle.
- R10k_C0_15
Instruction graduated
The counter is incremented with the number of instructions which have been
completed in the last cycle. An integer multiplication or division increments
the counter by 2.
- Counter 1:
- R10k_C1_0
Cycles
Machine cycles.
- R10k_C1_1
Instructions graduated
The counter is incremented by the number of instructions which have been
completed in the last cycle. An integer multiplication and division increments
by 2.
- R10k_C1_2
Load/prefetch/sync/CacheOp graduated
Every completed instruction of this type is counted.
- R10k_C1_3
Stores (including store-conditionals) graduated
Every completed store operation is counted.
- R10k_C1_4
Store conditionals graduated
Every conditional store is counted independently of success. This is possible
at most once a cycle.
- R10k_C1_5
Floating-point instructions graduated
Floating point instructions completed in the last cycle (0-4 each cycle).
- R10k_C1_6
Quadwords written back from primary cache
The counter is incremented by 1, if in a cycle at least one quadword is written
back from the 1st level cache to the 2nd level cache.
- R10k_C1_7
TLB refill exceptions
TLB misses are counted in the cycle after they occur.
- R10k_C1_8
Branches mispredicted
The counter is incremented on every mispredicted branch.
- R10k_C1_9
Primary data cache misses
Miss in the primary data cache.
- R10k_C1_10
Secondary cache misses (data)
Miss in the secondary cache caused by a data access.
- R10k_C1_11
Secondary cache way mispredicted (data)
The counter is incremented if the 2nd level cache controller tries to access
the 2nd level cache after a previous access failed.
- R10k_C1_12
External intervention request is determined to have hit in secondary cache
The processor got an external request for a copy of a 2nd level cache block.
- R10k_C1_13
External invalidate request is determined to have hit in secondary cache
The processor got an external request to invalidate a 2nd level cache block.
- R10k_C1_14
Stores/prefetches with store hint to CleanExklusive secondary cache blocks
The SCTP-logic got a request for status change of a cache line from
CleanExclusive to DirtyExklusive.
- R10k_C1_15
Stores/prefetches with store hint to Shared secondary cache blocks
The status of a cache line was changed from Shared to DirtyExklusive.
Different to the R10000, the R12000 has 4 counters each capable of
counting one of 32 events. For counter 1, a trigger mechanism was
included such that an event is counted by counter 1 if any of the
other counters reached a certain value. Additionally, conditional
counting is possible. For example, it is possible to count the number
of cycles in which 4 instructions have been completed. Also, some
semantic inaccuracies concerning the definition of events have been
clarified [5]. An introduction to measurement and interpretation
of events can be found in [6]. The counters are 32 bit wide.
The 4 counters may count any of the 32 events:
- R12k_0
Cycles
Machine cycles.
- R12k_1
Decoded instructions
Incremented by the total number of instructions decoded on the previous cycle.
- R12k_2
Decoded loads
Incremented when a load instruction was decoded on the previous cycle.
Prefetch, cache operations, and synchronization instructions are not included.
- R12k_3
Decoded stores
Incremented if a store instruction was decoded on the previous cycle. Store
conditionals are not included.
- R12k_4
Mishandling table occupancy
Incremented each cycle by the number of currently valid entries in the Miss
Handling Table (MHT).
- R12k_5
Failed store conditionals
Incremented when a store-conditional instruction fails.
- R12k_6
Resolved condition branches
Incremented both when a branch is determined to have been mispredicted and
when a branch is determined to have been correctly predicted.
- R12k_7
Quadwords written back from secondary cache
Counter is incremented each cycle a quad-word is written from the 2nd level
cache to the system interface unit.
- R12k_8
Correctable secondary cache data array ECC errors
Incremented each cycle following the correction of a 1-bit ECC error when
reading a quadword from the 2nd level cache.
- R12k_9
Primary instruction cache misses
Misses in the instruction cache.
- R12k_10
Secondary instruction cache misses
Instruction misses in the 2nd level cache.
- R12k_11
Instruction misprediction from secondary cache way prediction table
Incremented when the secondary cache control begins to retry an access
because it hit in the unpredicted way, provided the access that initiated the
access was an instruction fetch.
- R12k_12
External interventions
Incremented on the cycle after an intervention is entered into the Miss
Handling Table, provided that the intervention is not an invalidated type.
- R12k_13
External invalidations
Incremented on the cycle after an intervention is entered into the Miss
Handling Table, provided that the intervention is an invalidated type.
- R12k_14
ALU/FPU progress cycles
Incremented on the cycle after either ALU1, ALU2, FPU1, or FPU2 amrks an
instruction as done.
- R12k_15
Graduated instructions
The counter is incremented with the number of instructions which have been
completed in the last cycle. An integer multiplication or division increments
the counter by 2.
- R12k_16
Executed prefetch instruction
Incremented on the cycle after a prefetch instruction does its tag-check,
regardless of whether a data cache line refill is initiated.
- R12k_17
Prefetch primary data cache misses
Incremented on the cycle after a prefetch instruction does its tag-check and
a refill of the corresponding data cache line is initiated.
- R12k_18
Graduated Loads
Incremented by the number of loads that graduated on the previous cycle.
Prefetch instructions are included in this count. Up to four loads can
graduate in one cycle.
- R12k_19
Graduated Stores
Incremented on the cycle after a store graduates. Only one store can graduate
pre cycle. Store conditionals are included in this count.
- R12k_20
Graduated store conditions
Incremented on the cycle following the graduation of a store-conditional
instruction. Both failed and successful store-conditional instructions are
included in this count. So successful store-conditionals can be determined
as the difference between this event and event R12k_5.
- R12k_21
Graduated floating-point instructions
Incremenetd by the number of floatig-point instructions that graduated on the
previous cycle. There can be 0 to 4 such instructions.
- R12k_22
Quadwords written back from primary data cache
Incremented on each cycle that a quadword of data is valid and is written from
primary data cache to secondary cache.
- R12k_23
TLB misses
Incremented on the cycle after the TLB miss handler is invoked.
- R12k_24
Mispredicted branches
Incremented on the cycle after a branch is restored because it was mispredicted.
- R12k_25
Primary data cache misses
Incremented one cycle after a request is entered into the SCTP logic, provided
that the request was initially targeted at the primary data cache. Such requests
fall into three categories: primary data cache misses, requests to change the
state of secondary and primary data cache lines from clean to dirty due to
stores that hit a clen line in the primary data cache, and requests initiated
by cache instructions.
- R12k_26
Secondary data cache misses
Incremented the cycle after a refill request is sent to the system interface
module of the CPU.
- R12k_27
Data mispredictions from secondary cache way prediction table
Incremented when the secondary cache control begins to retry an access because
it hit in th eunpredicted way. The counter is incremented only if access that
initiated the access was not an instruction fetch.
- R12k_28
State of external intervention hits in secondary cache
Set on the cycle after an external intervention is determined to have hit in
the secondary cache. The value of the event is equal to the state of the
secondary cache line that was hit. Setting a performance control register to
select this event has a special effect on the conditional counting behavour.
- R12k_29
State of invalidation hits in secondary cache (L2)
Set on the cycle after an external invalidate request is determined to have
hit in secondary cache. Its value is equivalent to that dscribed for event
R12k_28.
- R12k_30
Miss Handling Table entries accessing memory
Incremented on each cycle by the number of entries in the Miss Handling Table
waiting for a memory operation to complete.
- R12k_31
Store/prefetch exclusive to shared block in secondary cache (L2)
Incremented on the cycle after an update request is issued for a line in the
secondary cache. If the line is in the clean state, the counter is incremented
by one. If the line is in the shared state, the counter is incremented by two.
The conditional counting mechanism can be used to select whether one, both,
or neither of these events is chosen.
Performance registers of UltraSPARC processors are controlled by the
Performance Control Register (PCR) which can be accessed only in
privileged mode. Accesses to the PIC-registers may be either in user
or privileged mode, dependent on a bit in the PCR which can be changed
in privileged mode. Event counting can be done either for the user
mode, system mode, or both. Overflow of the counters is silently. For
accurate timing, event counting should be done as taking the
difference between two reads of a performance counter.
Actual versions of the Solaris operating system have support for
performance counters in form of a programming interface (see man cpc).
The UltraSPARC I/II
64-bit
microprocessors of SUN have the possibility to count performance
relevant events. A detailed description of the SPARC V9 architecture
can be found in [7]. Both variants have 8 times 24 64-bit
registers which are organized in so-called windows to optimize
argument passing on subroutine calls without time-consuming copying of
registers to memory. The 1st level cache has a 16 KB data (D-cache)
and a 16 KB instruction cache (I-Cache). The 2nd level cache (E-cache)
has a size of 512 KB up to 4 MB on UltraSPARC I, and 512 KB up to 16
MB on UltraSPARC II. The main memory can be as large as 2 TB. Another
important component of the supporting logic is the UPA, the
Universal Port Architecture, which connects several processors over a
high-speed crossbar-switch.
The microprocessor contains two performance counters (PIC0, PIC1),
which are able to count different events. Each counter can count one
of 12 different events, two events can be counted on both counters,
which sums up to a total of 22 different events [8]. The
counters are 32 bit wide. Additionally, there exists a 64-bit elapsed
cycle counter.
- Tick Counter:
- ULTRA_TC
elapsed machine cycles
- Counter PIC0:
- ULTRA_C0_0
Cycle_cnt
Machine cycles.
- ULTRA_C0_1
Instr_cnt
Instructions graduated.
- ULTRA_C0_2
Dispatch0_IC_miss
Number of cycles waiting after a miss in the 1st level instruction cache
(including handling of a follow-on E-cache miss).
- ULTRA_C0_3
Dispatch0_storeBuf
Number of cycles a write buffer could not store new values (next instruction is
a store instruction).
- ULTRA_C0_4
IC_ref
1st level instruction cache references.
- ULTRA_C0_5
DC_rd
1st level data cache read references.
- ULTRA_C0_6
DC_wr
1st level data cache write references.
- ULTRA_C0_7
Load_use
Number of cycles instructions are waiting on a previous load operation.
- ULTRA_C0_8
EC_ref
Number of 2nd level cache references.
- ULTRA_C0_9
EC_write_hit_RDO
Number of hits on 2nd level cache read accesses in a
read for ownership-UPA-transaction.
- ULTRA_C0_10
EC_snoop_inv
Number of cache line invalidations due to a UPA-transactions.
- ULTRA_C0_11
EC_rd_hit
Number of E-cache read hits caused by 1st level data cache miss.
- Counter PIC1 counts:
- ULTRA_C1_0
Cycle_cnt
Machine cycles.
- ULTRA_C1_1
Instr_cnt
Instructions graduated.
- ULTRA_C1_2
Dispatch0_mispred
Number of cycles waiting with an empty instruction buffer after a wrong branch
prediction.
- ULTRA_C1_3
Dispatch0_FP_use
Number of cycles which waits the first instruction in a group because the
result of a previous floating-point operation is not available.
- ULTRA_C1_4
IC_hit
Number of 1st level instruction cache hits.
- ULTRA_C1_5
DC_rd_hit
Number of 1st level data cache read hits.
- ULTRA_C1_6
DC_wr_hit
Number of 1st level data cache write hits.
- ULTRA_C1_7
Load_use_RAW
Number of cycles load operations spent in the instruction pipeline while at the
same time a read-write-inconsistency exists because of a not-completed load
operation.
- ULTRA_C1_8
EC_hit
Number of 2nd level cache hits.
- ULTRA_C1_9
EC_wb
Number of 2nd level cache misses causing a write-back operation.
- ULTRA_C1_10
EC_snoop_cb
Number of UPA-transactions which caused a copy-back of a 2nd level cache line.
- ULTRA_C1_11
EC_ic_hit
Number of 2nd level cache read hits caused by a 1st level instruction cache
miss.
There are hardware erratas documenting problems in counting certain
events. These problems might affect events of type PCL_L2CACHE_MISS,
PCL_L1DCACHE_MISS, PCL_L1ICACHE_READWRITE, PCL_L1ICACHE_HIT,
PCL_L1ICACHE_MISS.
The microprocessor contains two performance counters (PIC0, PIC1),
each of them 32 bit wide. Additionally, there exists a 64-bit elapsed
cycle counter.
- Tick Counter:
- ULTRA3_TC
elapsed machine cycles
- Counter PIC0:
- ULTRA3_C0_0
Cycle_cnt
Machine cycles.
- ULTRA3_C0_1
Instr_cnt
Instructions completed.
- ULTRA3_C0_2
Dispatch0_IC_miss
Number of cycles waiting after a miss in the 1st level instruction cache
(including handling of a follow-on E-cache miss).
- ULTRA3_C0_3
Dispatch0_br_target
Number of cycles waiting caused by a branch target address calculation
- ULTRA3_C0_4
Dispatch0_2nd_br
Number of cycles waiting caused by a refetch of a second branch
- ULTRA3_C0_5
RStall_storeQ
Store queue full
- ULTRA3_C0_6
Rstall_IU_use
Number of stall because integer result is not available
- ULTRA3_C0_8
IC_ref
Number of references to 1st level instruction cache
- ULTRA3_C0_9
DC_rd
Number of reads from 1st level data cache
- ULTRA3_C0_10
DC_wr
Number of writes to 1st level data cache
- ULTRA3_C0_12
EC_ref
Number of 2nd level cache (E-cache) references
- ULTRA3_C0_13
EC_write_hit_RTO
E-cache hits with read-to-own bus transaction
- ULTRA3_C0_14
EC_snoop_inv
Number of E-cache invalidations caused by an external snoop
- ULTRA3_C0_15
EC_rd_miss
Number of E-cache read misses caused by 1st level data cache requests
- ULTRA3_C0_16
PC_port0_rd
Prefetch cache read references to 1st port
- ULTRA3_C0_17
SI_snoop
Number of snoops from other processors
- ULTRA3_C0_18
SI_ciq_flow
Number of system cycles with flow control asserted from this processor
- ULTRA3_C0_19
SI_owned
Number of times owned_in is asserted on requests of this processor
- ULTRA3_C0_20
SW_count_0
Number of occurences of special sethi-instructions
- ULTRA3_C0_21
IU_Stat_Br_miss_taken
Number of retired branches, that were predicted to be taken but that were not
taken
- ULTRA3_C0_22
IU_Stat_Br_count_taken
Number of retired taken branches
- ULTRA3_C0_23
Dispatch_rs_mispred
Number of times instruction queue is empty because of return address
stack misprediction
- ULTRA3_C0_24
FA_pipe_completion
Number of instructions completed on Floating Point / Graphics ALU pipeline
- ULTRA3_C0_32
MC_reads_0
Number of completed read requests on memory bank 0
- ULTRA3_C0_33
MC_reads_1
Number of completed read requests on memory bank 1
- ULTRA3_C0_34
MC_reads_2
Number of completed read requests on memory bank 2
- ULTRA3_C0_35
MC_reads_3
Number of completed read requests on memory bank 3
- ULTRA3_C0_36
MC_stalls_0
Number of cycles memory controller was stalled because of bank busy 0
- ULTRA3_C0_37
MC_stalls_2
Number of cycles memory controller was stalled because of bank busy 2
- Counter PIC1 counts:
- ULTRA3_C1_0
Cycle_cnt
Machine cycles.
- ULTRA3_C1_1
Instr_cnt
Instructions completed.
- ULTRA3_C1_2
Dispatch0_mispred
Number of cycles waiting with an empty instruction buffer after a wrong branch
prediction.
- ULTRA3_C1_3
IC_miss_cancelled
Number of I-cache misses cancelled
- ULTRA3_C1_4
Re_endian_miss
Number of little endian loads that were predicted to be a big-endian load
- ULTRA3_C1_5
Re_FPU_bypass
Number of times a FPU bypass condition occured that does not have a direct
bypass pass occured
- ULTRA3_C1_6
Re_DC_miss
Number of 1st level data cache misses
- ULTRA3_C1_7
Re_EC_miss
Number of 2nd level cache misses
- ULTRA3_C1_8
IC_miss
Number of 1st level instructions cache misses
- ULTRA3_C1_9
DC_rd_miss
Number of 1st level data cache read misses
- ULTRA3_C1_10
DC_write_miss
Number of 1st level data cache write misses
- ULTRA3_C1_11
Rstall_FP_use
Number of stalls because FP results are not available
- ULTRA3_C1_12
EC_misses
Number of 2nd level cache misses
- ULTRA3_C1_13
EC_wb
Number of 2nd level cache writebacks (dirty blocks) caused by cache misses
- ULTRA3_C1_14
EC_snoop_cb
Number of 2nd level cache copybacks due to external snoops
- ULTRA3_C1_15
EC_ic_miss
Number of 2nd level cache read misses from 1st level instruction cache requests
- ULTRA3_C1_16
Re_PC_miss
Number of prefetch cache misses on a second load
- ULTRA3_C1_17
ITLB_miss
Number of misses of the instruction TLB
- ULTRA3_C1_18
DTLB_miss
Number of misses of the data TLB
- ULTRA3_C1_19
WC_miss
Number of write cache misses
- ULTRA3_C1_20
WC_snoop_cb
Number of write cache copybacks caused by external snoop
- ULTRA3_C1_21
WC_scrubbed
Number of write cache hits to clean lines
- ULTRA3_C1_22
WC_wb_wo_read
Number of write cache writebacks without reads
- ULTRA3_C1_24
PC_soft_hit
Number of software prefetched prefetch cache hits
- ULTRA3_C1_25
PC_snoop_inv
Number of prefetch cache invalidates generated by external snoops and
internal stores
- ULTRA3_C1_26
PC_hard_hit
Number of hardware prefetched prefetch cache hits
- ULTRA3_C1_27
PC_port1_rd
Number of prefetch cache cacheable read references to 1st port
- ULTRA3_C1_28
SW_count_1
Number of occurences of special sethi-instructions
- ULTRA3_C1_29
IU_Stat_Br_mis_untaken
Number of retired braches that were predicted to be untaken but were taken
- ULTRA3_C1_30
IU_Stat_Br_count_untaken
Number of retired untaken branches
- ULTRA3_C1_31
PC_MS_misses
Number of prefetch cache address misses
- ULTRA3_C1_32
MC_writes_0
Number of completed write requests to memory bank 0
- ULTRA3_C1_33
MC_writes_1
Number of completed write requests to memory bank 1
- ULTRA3_C1_34
MC_writes_2
Number of completed write requests to memory bank 2
- ULTRA3_C1_35
MC_writes_3
Number of completed write requests to memory bank 3
- ULTRA3_C1_36
MC_stalls_1
Number of cycles memory controller was stalled because of bank busy 1
- ULTRA3_C1_37
MC_stalls_3
Number of cycles memory controller was stalled because of bank busy 3
- ULTRA3_C1_38
Re_RAW_miss
Number of load stalls because of stores
- ULTRA3_C1_39
FM_pipe_completion
Number of instructions completed on Floating Point / Graphics multiply pipeline
The PowerPC 604 has 2 performance counters.
- Counter 1 counts:
- PPC604_C0_0
PM_NOTHING
No events counted. Register counter holds current value.
- PPC604_C0_1
PM_CYC
Processor cycles are counted.
- PPC604_C0_2
PM_INST_CMPL
Count the numbers of instructions completed every cycle.
- PPC604_C0_3
PM_TB_BIT_TRANS
RTCSELECT bit transition. 0 = 47, 1 = 51, 2 = 55, 3 = 63 (bits from the time base lower register).
- PPC604_C0_4
PM_INST_DISP
Number of instructions dispatched.
- PPC604_C0_5
PM_IC_MISS
Instruction cache misses.
- PPC604_C0_6
PM_DTLB_MISS
Data TLB misses (not speculative).
- PPC604_C0_7
PM_BR_MPRED
Branch incorrectly predicted.
- PPC604_C0_8
PM_RESRV_RQ
Number of reservations requested.
- PPC604_C0_9
PM_LD_MISS_EXCEED_L2
Number of data cache load misses exceeding the threshold value with lateral L2
cache intervention.
- PPC604_C0_10
PM_ST_MISS_EXCEED_L2
Number of data cache store misses exceeding the threshold value with lateral L2 cache intervention.
- PPC604_C0_11
PM_MTSPRS_DISP
Number of mtspr instructions dispatched.
- PPC604_C0_12
PM_SYNC
Number of sync instructions completed.
- PPC604_C0_13
PM_EIEIO
Number of eieio instructions completed.
- PPC604_C0_14
PM_FXU_CMPL
Number of integer instructions completed every cycle (no loads or stores).
- PPC604_C0_15
PM_FPU_CMPL
Number of floating-point instructions completed every cycle (no loads or stores).
- PPC604_C0_16
PM_LS_EXEC
LSU produced result without an exception condition.
- PPC604_C0_17
PM_SFX1_FINISH
SCIU1 produced result. (add, subtract, compare, rotate, shift, or logical instruction.)
- PPC604_C0_18
PM_FPU_FINISH
FPU produced result.
- PPC604_C0_19
PM_LS_DISP
Number of instructions dispatched to the LSU.
- PPC604_C0_20
PM_SFX1_DISP
Number of instructions dispatched to the SCIU1.
- PPC604_C0_21
PM_FPU_DISP
Number of instructions dispatched to the FPU.
- PPC604_C0_22
PM_SNOOP_RECV
Snoop requests received. Valid snoop from outside the 604. Does not know if it is a
hit or miss.
- PPC604_C0_23
PM_LD_MISS_EXCEED_NO_L2
Number of data cache load misses exceeding the threshold value without lateral L2 intervention.
- PPC604_C0_24
PM_ST_MISS_EXCEED_NO_L2
Number of data cache store misses exceeding the threshold value without lateral L2 intervention.
- Counter 2 counts:
- PPC604_C1_0
PM_NOTHING
No events counted. Register counter holds current value.
- PPC604_C1_1
PM_CYC
Processor cycles 0b1. Count every cycle.
- PPC604_C1_2
PM_INST_CMPL
Number of instructions completed. Legal values are 000, 001, 010, 011, 100.
- PPC604_C1_3
PM_TB_BIT_TRANS
RTCSELECT bit transition. 0 = 47, 1 = 51, 2 = 55, 3 = 63 (bits from the time
base lower register).
- PPC604_C1_4
PM_INST_DISP
Number of instructions dispatched (0 to 4 instructions per cycle).
- PPC604_C1_5
PM_LD_MISS_CYC
Number of cycles a load miss takes.
- PPC604_C1_6
PM_DC_MISS
Data cache misses (in order).
- PPC604_C1_7
PM_ITLB_MISS
Number of instruction TLB misses.
- PPC604_C1_8
PM_BR_CMPL
Number of branches completed. Indicates the number of branch instructions
being completed every cycle (00 = none, 10 = one, 11 = two, 01 is an illegal value).
- PPC604_C1_9
PM_RESRV_CMPL
Number of reservations successfully obtained (stwcx. operation completed successfully).
- PPC604_C1_10
PM_MFSPR_DISP
Number of mfspr instructions dispatched (in order).
- PPC604_C1_11
PM_ICBI
Number of icbi instructions. It may not hit in the cache.
- PPC604_C1_12
PM_SYNCHRO_INST_CMPL
Number of pipeline "flushing" instructions (sc, isync, mtspr (XER), mcrxr,
floating-point operation with divide by 0 or invalid operand and
MSR[FE0, FE1] = 00, branch with MSR[BE] = 1, load string indexed with XER = 0,
and SO bit getting set).
- PPC604_C1_13
PM_BR_FINISH
BPU produced result.
- PPC604_C1_14
PM_SFX0_FINISH
SCIU0 produced result (of an add, subtract, compare, rotate, shift, or logical instruction).
- PPC604_C1_15
PM_CFX_FINISH
MCIU produced result (of a multiply/divide or SPR instruction).
- PPC604_C1_16
PM_BR_DISP
Number of instructions dispatched to the branch unit.
- PPC604_C1_17
PM_SFX=_DISP
Number of instructions dispatched to the SCIU0.
- PPC604_C1_18
PM_LD_CMPL
Number of loads completed. These include all cache operations and tlbie,
tlbsync, sync, eieio, and icbi instructions.
- PPC604_C1_19
PM_CFX_DISP
Number of instructions dispatched to the MCIU.
- PPC604_C1_20
PM_SNOOP_HIT
Number of snoop hits occurred.
The PowerPC 604e
is a
32-bit microprocessor with 32 32-bit integer and 32 32-bit floating
point registers. The 1st level cache consists of a 32 KB data cache
(D-cache) and a 32 KB instruction cache (I-cache). Different to other
microprocessors, the PowerPC 604e has no on-chip logic to control a
2nd level chip but signals are available for additional cache logic
[9]. Additionally, there exist performance counter events
concerning the 2nd level cache. A detailed description of the PowerPC
architecture can be found in [10]. The performance counters are
32 bit wide.
The pipelines of the PowerPC 604e consist of:
- a 5-stage branch unit (BPU/CRU)
- a 6-stage integer unit (SCIU1/SCIU2/MCIU)
- a 7-stage load/store unit (LSU)
- an 8-stage floating-point unit (FPU)
Sub-unit names are:
- BPU branch prediction unit
- CRU control register unit
- SCIUx single-cycle integer unit
- MCIU multiple-cycle integer unit
The PowerPC 604e has 4 performance counters (PMC1/PMC2/PMC3/PMC4) capable of
counting 116 different events [11].
- Counter PMC1 counts:
- PPC604e_C0_0
000 0000 Nothing. Register counter holds current value.
The counter keeps its current value.
- PPC604e_C0_1
000 0001 Processor cycles 0b1. Count every cycle.
Number of cycles the processor executes ''0b1''.
- PPC604e_C0_2
000 0010 Number of instructions completed every cycle.
Number of instructions completed each cycle.
- PPC604e_C0_3
000 0011 RTCSELECT bit transition. 0 = 47, 1 = 51, 2 = 55, 3 = 63 (bits from the time base lower register).
Bit-transitions on the RTCSELECT-Pin.
- PPC604e_C0_4
000 0100 Number of instructions dispatched.
Number of instructions arrived at the 3rd stage of the instruction pipeline.
- PPC604e_C0_5
000 0101 Instruction cache misses.
Number of 1st level instruction cache misses.
- PPC604e_C0_6
000 0110 Data TLB misses (in order).
Number of misses in the translation look-aside buffer for data.
- PPC604e_C0_7
000 0111 Branch misprediction correction from execute stage.
Number of correctable branch misses in the execution phase of the 4th stage of
the pipeline.
- PPC604e_C0_8
000 1000 Number of reservations requested. The lwarx instruction is
ready for execution in the LSU.
Number of reservations for an atomic load instruction in the LSU.
- PPC604e_C0_9-PPC604e_C0_10
000 1001 Number of data cache load misses exceeding the threshold value
with lateral L2 cache intervention.
000 1010 Number of data cache store misses exceeding the threshold value
with lateral L2 cache intervention.
Number of 1st level data cache misses which exceeded a limit value and
additionally, L2_INT signal was active.
- PPC604e_C0_11
000 1011 Number of mtspr instructions dispatched.
Number of mtspr instructions arrived at the 3rd stage of the pipeline.
- PPC604e_C0_12-PPC604e_C0_15
000 1100 Number of sync instructions completed.
000 1101 Number of eieio instructions completed.
000 1110 Number of integer instructions completed every cycle
(no loads or stores).
000 1111 Number of floating-point instructions completed every cycle
(no loads or stores).
Number of completed mtspr/sync/eieio/integer/floating-point instructions.
- PPC604e_C0_16-PPC604e_C0_18
001 0000 LSU produced result.
001 0001 SCIU1 produced result for an add, subtract, compare, rotate,
shift, or logical instruction.
001 0010 FPU produced result.
Number of results generated at the LSU/SCIU1/FPU units.
- PPC604e_C0_19-PPC604e_C0_21
001 0011 Number of instructions dispatched to the LSU.
001 0100 Number of instructions dispatched to the SCIU1.
001 0101 Number of instructions dispatched to the FPU.
Number of instructions issued from the 3rd stage of the instruction pipeline to
the LSU/SCIU1/FPU unit.
- PPC604e_C0_22
001 0110 Valid snoop requests received from outside the 604e. Does not
distinguish hits or misses.
Number of snoop requests.
- PPC604e_C0_23-PPC604e_C0_24
001 0111 Number of data cache load misses exceeding the threshold value
without lateral L2 intervention.
001 1000 Number of data cache store misses exceeding the threshold value
without lateral L2 intervention.
Number of 1st level data cache misses which exceeded a limit value and
additionally, L2_INT signal was not active.
- PPC604e_C0_25-PPC604e_C0_27
001 1001 Number of cycles the branch unit is idle.
001 1010 Number of cycles MCIU0 is idle.
001 1011 Number of cycles the LSU is idle. No new instructions are
executing; however, active loads or stores may be in the queues.
Number of cycles the BPU/MCIU0/LSU units were idle.
- PPC604e_C0_28
001 1100 Number of times the L2_INT is asserted
(regardless of TA state).
Number of times L2_INT signal was asserted.
- PPC604e_C0_29
001 1101 Number of unaligned loads.
Number of unaligned loads.
- PPC604e_C0_30
001 1110 Number of entries in the load queue each cycle (maximum of five).
Although the load queue has four entries, a load miss latch may hold a load waiting
for data from memory.
Number of load queue entries per cycle (max. of 5).
- PPC604e_C0_31
001 1111 Number of instruction breakpoint hits.
Number of times instructions hit a breakpoint.
- Counter PMC2 counts:
- PPC604e_C1_0
00 0000 Nothing. Register counter holds current value.
The counter keeps its current value.
- PPC604e_C1_1
00 0001 Processor cycles 0b1. Count every cycle.
Number of cycles the processor executes ''0b1''.
- PPC604e_C1_2
00 0010 Number of instructions completed every cycle.
Number of instructions completed every cycle.
- PPC604e_C1_3
00 0011 RTCSELECT bit transition. 0 = 47, 1 = 51, 2 = 55, 3 = 63
(bits from the time base lower register).
Number of bit transitions on the RTCSELECT-pin.
- PPC604e_C1_4
00 0100 Number of instructions dispatched.
Number of instructions dispatched to the 3rd stage of the instruction pipeline.
- PPC604e_C1_5
00 0101 Number of cycles a load miss takes.
Number of load miss cycles.
- PPC604e_C1_6
00 0110 Data cache misses (in order).
Number of 1st level data cache misses.
- PPC604e_C1_7
00 0111 Number of instruction TLB misses.
Number of misses in the translation look-aside buffer for instructions.
- PPC604e_C1_8
00 1000 Number of branches completed. Indicates the number of branch
instructions being completed every cycle (00 = none, 10 = one, 11 = two, 01
is an illegal value).
Number of completed branch instructions every cycle (max. of 2).
- PPC604e_C1_9
00 1001 Number of reservations successfully obtained (stwcx. operation
completed successfully).
Number of successfully completed atomic store instructions.
- PPC604e_C1_10
00 1010 Number of mfspr instructions dispatched (in order).
Number of mfspr-instructions arrived at the 3rd stage of the instruction
pipeline.
- PPC604e_C1_11
00 1011 Number of icbi instructions. It may not hit in the cache.
Number of icbi-instructions without necessary hitting the cache.
- PPC604e_C1_12
00 1100 Number of pipeline ''flushing'' instructions (sc, isync, mtspr
(XER), mcrxr, floating-point operation with divide by 0 or invalid operand
and MSR[FE0, FE1] = 00, branch with MSR[BE] = 1, load string indexed with
XER = 0, and SO bit getting set)
Number of instructions flushing the pipeline.
- PPC604e_C1_13-PPC604e_C1_15
00 1101 BPU produced result.
00 1110 SCIU0 produced result (of an add, subtract, compare, rotate,
shift, or logical instruction).
00 1111 MCIU produced result (of a multiply/divide or SPR instruction).
Number of results produced by the BPU/SCIU0/MCIU-units.
- PPC604e_C1_16-PPC604e_C1_17
01 0000 Number of instructions dispatched to the branch unit.
01 0001 Number of instructions dispatched to the SCIU0.
Number of instructions issued from the 3rd stage of the instruction pipeline
to the BPU/SCIU0-units.
- PPC604e_C1_18
01 0010 Number of loads completed. These include all cache operations
and tlbie, tlbsync, sync, eieio and icbi instructions.
Number of completed load instructions.
- PPC604e_C1_19
01 0011 Number of instructions dispatched to the MCIU.
Number of instructions issued from the 3rd stage of the instruction pipeline to
the MCIU-unit.
- PPC604e_C1_20
01 0100 Number of snoop hits occurred.
Number of snoop hits.
- PPC604e_C1_21
01 0101 Number of cycles during which the MSR[EE] bit is cleared.
Number of cycles during which the MSR[EE] bit is cleared.
- PPC604e_C1_22-PPC604e_C1_24
01 0110 Number of cycles the MCIU is idle.
01 0111 Number of cycles SCIU1 is idle.
01 1000 Number of cycles the FPU is idle.
Number of cycles the SCIU1/MCIU/FPU-unit is idle.
- PPC604e_C1_25
01 1001 Number of cycles the L2_INT signal is active (regardless of
TA state).
Number of cycles the L2_INT-pin had an active level.
- PPC604e_C1_26-PPC604e_C1_30
01 1010 Number of times four instructions were dispatched.
01 1011 Number of times three instructions were dispatched.
01 1100 Number of times two instructions were dispatched.
01 1101 Number of times one instruction was dispatched.
Number of times 1/2/3/4 instructions arrived at the 3rd stage of the
instruction pipeline.
- PPC604e_C1_31
01 1110 Number of unaligned stores.
Number of unaligned stores.
- PPC604e_C1_32
01 1111 Number of entries in the store queue each cycle
(maximum of six).
Number of entries in the store-queue every cycle (max. of 6).
- Counter PMC3 counts:
- PPC604e_C2_0
0 0000 Nothing. Register counter holds current value.
The counter keeps its current value.
- PPC604e_C2_1
0 0001 Processor cycles 0b1. Count every cycle.
Number of cycles the processor executes ''0b1''.
- PPC604e_C2_2
0 0010 Number of instructions completed every cycle.
Number of instructions completed every cycle.
- PPC604e_C2_3
0 0011 RTCSELECT bit transition. 0 = 47, 1 = 51, 2 = 55, 3 = 63
(bits from the time base lower register).
Number of bit-transitions on the RTCSELECT-pin.
- PPC604e_C2_4
0 0100 Number of instructions dispatched.
Number of instructions arrived at the 3rd stage of the instruction pipeline.
- PPC604e_C2_5-PPC604e_C2_7
0 0101 Number of cycles the LSU stalls due to BIU or cache busy. Counts
cycles between when a load or store request is made and a response was
expected. For example, when a store is retried, there are four cycles before
the same instruction is presented to the cache again. Cycles in between are
not counted.
0 0110 Number of cycles the LSU stalls due to a full store queue.
0 0111 Number of cycles the LSU stalls due to operands not available in
the reservation station.
Number of cycles the LSU-unit was blocked either because the LSU-unit was busy
or the cache was busy or the store queue was full or an operand was not
available.
- PPC604e_C2_8
0 1000 Number of instructions written into the load queue. Misaligned
loads are split into two transactions with the first part always written into
the load queue. If both parts are cache hits, data is returned to the rename
registers and the first part is flushed from the load queue. To count the
instructions that enter the load queue to stay, the misaligned load hits must
be subtracted.
Number of instructions in the load queue.
- PPC604e_C2_9
0 1001 Number of cycles that completion stalls for a store instruction.
Number of cycles that completion stalls for a store instruction.
- PPC604e_C2_10
0 1010 Number of cycles that completion stalls for an
unfinished instruction.
Number of cycles that completion stalls for an unfinished instruction.
- PPC604e_C2_11
0 1011 Number of system calls.
Number of system calls.
- PPC604e_C2_12
0 1100 Number of cycles the BPU stalled as branch waits for its operand.
Number of cycles the BPU waits for an operand.
- PPC604e_C2_13
0 1101 Number of fetch corrections made at the dispatch stage.
Prioritized behind the execute stage.
Number of fetch corrections made at the 3rd stage of the instruction pipeline.
- PPC604e_C2_14
0 1110 Number of cycles the dispatch stalls waiting for instructions.
Number of cycles the 1st stage of the instruction pipeline waited for
instructions.
- PPC604e_C2_15
0 1111 Number of cycles the dispatch stalls due to unavailability of
reorder buffer (ROB) entry. No ROB entry was available for the first
non-dispatched instruction.
Number of cycles the 1st stage of the instruction pipeline waited because the
reorder buffer was not available.
- PPC604e_C2_16
1 0000 Number of cycles the dispatch unit stalls due to no FPR rename
buffer available. First non-dispatched instruction required a floating-point
reorder buffer and none was available.
Number of cycles the 1st stage of the instruction pipeline waited because the
FPR-rename buffer was not available.
- PPC604e_C2_17-PPC604e_C2_18
1 0001 Number of instruction table search operations.
1 0010 Number of data table search operations. Completion could result
from a page fault or a PTE match.
Number of search operations in the data/instruction table.
- PPC604e_C2_19-PPC604e_C2_20
1 0011 Number of cycles the FPU stalled.
1 0100 Number of cycles the SCIU1 stalled.
Number of cycles the FPU-/SCIU1-unit was blocked.
- PPC604e_C2_21
1 0101 Number of times the BIU forwards non-critical data from the
line-fill buffer.
Number of transfers of uncritical data from the line-fill buffer done by the
bus-interface unit and initiated by the BIU.
to the
- PPC604e_C2_22
1 0110 Number of data bus transactions completed with pipelining one deep
with no additional bus transactions queued behind it.
Number of completed data bus transactions without additional bus transactions
queued.
- PPC604e_C2_23
1 0111 Number of data bus transactions completed with two data bus
transactions queued behind.
Number of completed data bus transactions with two additional bus transactions
queued.
- PPC604e_C2_24
1 1000 Counts pairs of back-to-back burst reads streamed without a dead
cycle between them in data streaming mode
Number of paired back-to-back-burst-read accesses without intervening
idle cycles.
- PPC604e_C2_25
1 1001 Counts non-
 processor kill transactions caused
by a write-hit-on-shared condition
processor kill transactions caused
by a write-hit-on-shared condition
Number of invalidated cache lines caused by a write hit to a shared line.
- PPC604e_C2_26
1 1010 This event counts non-
write-with-kill address
operations that originate from the three castout buffers. These include
high-priority write-with-kill transactions caused by a snoop hit on modified
data in one of the BIU's three copy-back buffers. When the cache block on a
data cache miss is modified, it is queued in one of three copy-back buffers.
The miss is serviced before the copy-back buffer is written back to memory as
a write-with-kill transaction.
Number of Write-with-kill-address operations.
- PPC604e_C2_27
1 1011 Number of cycles when exactly two castout buffers are occupied.
Number of cycles when exactly two castout buffers are occupied.
Castout-buffer are used to write 1st level data cache lines to memory.
- PPC604e_C2_28
1 1100 Number of data cache accesses retried due to occupied castout
buffers.
Number of retried 1st ;level data cache accesses due to occupied castout
buffer.
- PPC604e_C2_29
1 1101 Number of read transactions from load misses brought into the
cache in a shared state.
Number of read transactions which (after a miss) brought a 1st level cache line
into the cache with a status of shared.
- PPC604e_C2_30
1 1110 CRU Indicates that a CR logical instruction is being finished.
Number of logical instructions completed in the CRU.
- Counter PMC4 counts:
- PPC604e_C3_0
0 0000 Nothing. Register counter holds current value.
The counter keeps its current value.
- PPC604e_C3_1
0 0001 Processor cycles 0b1. Count every cycle.
Number of cycles the processor executes ''0b1''.
- PPC604e_C3_2
0 0010 Number of instructions completed every cycle.
Number of instructions every cycle.
- PPC604e_C3_4
0 0011 RTCSELECT bit transition. 0 = 47, 1 = 51, 2 = 55, 3 = 63
(bits from the time base lower register).
Number of bit-transitions on the RTCSELECT-pin.
- PPC604e_C3_5
0 0100 Number of instructions dispatched.
Number of instructions arrived at the 3rd stage of the instruction pipeline.
- PPC604e_C3_6-PPC604e_C3_8
0 0101 Number of cycles the LSU stalls due to busy MMU.
0 0110 Number of cycles the LSU stalls due to the load queue full.
0 0111 Number of cycles the LSU stalls due to address collision.
Number of cycles the LSU stalled because of a busy MMU, full load queue, or
address collision.
- PPC604e_C3_9
0 1000 Number of misaligned loads that are cache hits for both the first
and second accesses.
Number of misaligned loads that are cache hits for both the first and second
accesses.
- PPC604e_C3_10
0 1001 Number of instructions written into the store queue.
Number of instructions written into the store queue.
- PPC604e_C3_11
0 1010 Number of cycles that completion stalls for a load instruction.
Number of cycles the completion of an instructions stalled because of a load
instruction.
- PPC604e_C3_12
0 1011 Number of hits in the BTAC. Warning-if decode buffers cannot
accept new instructions, the processor re-fetches the same address multiple
times.
Number of hits in the Branch Target Address Cache.
- PPC604e_C3_13
0 1100 Number of times the four basic blocks in the completion buffer
from which instructions can be retired were used
Number of times the four basic blocks in the completion buffer from which
instructions can be retired were used.
- PPC604e_C3_14
0 1101 Number of fetch corrections made at decode stage.
Number of corrections made between the 1st and 2nd stage of the instruction
pipeline.
- PPC604e_C3_15-PPC604e_C3_18
0 1110 Number of cycles the dispatch unit stalls due to no unit available.
First non-dispatched instruction requires an execution unit that is either full
or a previous instruction is being dispatched to that unit.
0 1111 Number of cycles the dispatch unit stalls due to unavailability of
GPR rename buffer. First non-dispatched instruction requires a GPR reorder
buffer and none are available.
1 0000 Number of cycles the dispatch unit stalls due to no CR rename
buffer available. First non-dispatched instruction requires a CR rename buffer
and none is available.
1 0001 Number of cycles the dispatch unit stalls due to CTR/LR interlock.
First non-dispatched instruction could not dispatch due to CTR/LR/mtcrf
interlock.
Number of cycles spent at the 3rd stage of the instruction pipeline waiting for
any of the conditions:
- in the 4th stage of the pipeline (MCIU/SCIU0/SCIU1..) was no unit
available
- no GPR-Rename-Buffer was available
- no CR-Rename-Buffer was available
- the Counter- or Link-Register was locked
- PPC604e_C3_19-PPC604e_C3_20
1 0010 Number of cycles spent doing instruction table search operations.
1 0011 Number of cycles spent doing data table search operations.
Number of cycles spent searching in the data/instruction table.
- PPC604e_C3_21-PPC604e_C3_22
1 0100 Number of cycles SCIU0 was stalled.
1 0101 Number of cycles MCIU was stalled.
Number of cycles the MCIU/SCIU0 was stalled.
- PPC604e_C3_23
1 0110 Number of bus cycles after an internal bus request without a
qualified bus grant.
Number of bus-cycles after an internal bus request without a qualified bus
grant.
- PPC604e_C3_24
1 0111 Number of data bus transactions completed with one data bus
transaction queued behind
Number of completed data-bus transactions with one data bus transaction queued
behind.
- PPC604e_C3_25
1 1000 Number of write data transactions that have been reordered before
a previous read data transaction using the DBWO feature
Number of write data transactions that have been reordered before a previous
read data transaction.
- PPC604e_C3_26
1 1001 Number of
processor address bus transactions.
Number of address bus transactions caused by a signal change at the
-pin.
- PPC604e_C3_27
1 1010 Number of high-priority snoop pushes. Snoop transactions, except
for write-with-kill, that hit modified data in the data cache cause a
high-priority write (snoop push) of that modified cache block to memory. This
operation has a transaction type of write-with-kill. This event counts the
number of non-
processor write-with-kill transactions that
were caused by a snoop hit on modified data in the data cache. It does not
count high-priority write-with-kill transactions caused by snoop hits on
modified data in one of the BIU's three copy-back buffers.
Number of high-priority snoop pushes.
- PPC604e_C3_28-PPC604e_C3_29
1 1011 Number of cycles for which exactly one castout buffer is occupied
1 1100 Number of cycles for which exactly three castout buffers are
occupied
Number of cycles for which exactly one/three castout buffer is/are occupied.
- PPC604e_C3_30
1 1101 Number of read transactions from load misses brought into the
cache in an exclusive (E) state
Number of read transactions caused by a load miss and which got brought into
the cache in exclusive state.
- PPC604e_C3_31
1 1110 Number of un-dispatched instructions beyond branch
Number of undispatched instructions beyond branch.
IBM has the
PMapi
library which supports access to the performance counters on different
PowerPC and POWER chips. PMapi supports the distinction between
supervisor mode, problem (user) mode, or both. On AIX versions 4.2 and
higher, performance counter status is saved and restored on context
switches.
The POWER3 has 8 performance counters. Missing counter/event
pairs mean an unused event for that counter. To be consistent with the
numbering scheme with start numbering with POWER3_C0_xx for counter
1.
- Counter 1 counts:
- POWER3_C0_0
PM_CYC
Processor clock cycles
- POWER3_C0_1
PM_INST_CMPL
Number of instructions completed
- POWER3_C0_2
PM_TB_BIT_TRANS
Selected Time Base output
- POWER3_C0_3
PM_INST_DISP
Number of instructions dispatched
- POWER3_C0_4
PM_LD_CMPL
Number of load instructions completed (max. 4 per cycle)
- POWER3_C0_5
PM_IC_MISS
L1 I-cache miss
- POWER3_C0_6
PM_LD_MISS_L2HIT
A load miss occured in L1
- POWER3_C0_7
PM_LD_MISS_EXCEED_NO_L2
Thresholder counting tagged loads (no L2 intervention)
- POWER3_C0_9
PM_ST_MISS_EXCEED_NO_L2
Thresholder counting a tagged store (no L2 intervention)
- POWER3_C0_10
PM_BURSTRD_L2MISS_W_INT
L2 burst read miss & another processor has a modified copy
- POWER3_C0_12
PM_PM_IC_MISS_USED
An icache miss line was brought in and used
- POWER3_C0_13
PM_DU_ECAM/RCAM_OFFSET_HIT
The ECAM/RCAM logic detected an offset hit from DU
- POWER3_C0_14
PM_GLOBAL_CANCEL_INST_DEL
Number of instructions deleted on global cancel
- POWER3_C0_15
PM_CHAIN_1_TO_8
Chain counter History Mode with PMC1[msb] chained to PMC[lsb]
- POWER3_C0_16
PM_FPU0_BUSY
Floating Point Unit 0 busy
- POWER3_C0_17
PM_DSLB_MISS
D-cache SLB miss occured
- POWER3_C0_18
PM_TAG_ST_DISP_LSU0
LSU0 issued a tagged store request to D-cache
- POWER3_C0_19
PM_TLB_MISS
TLB miss. Includes both D-cache and I-cache misses
- POWER3_C0_20
PM_EE_OFF
The MSR EE bit is off
- POWER3_C0_21
PM_BRU_IDLE
Branch Unit is idle
- POWER3_C0_22
PM_SYNCHRO_INST
A single instruction serialization is executing
- POWER3_C0_24
PM_CYC_1STBUF_OCCP
Number of cycles 1 and only 1 store buffer is occupied
- POWER3_C0_25
PM_SNOOP_L1_M_TO_E_OR_S
Number of snoop based L1 transitions from M to E or S
- POWER3_C0_26
PM_ST_CMPL_BF_AT_GC
Number of stores in the completion bffer at global cancel
- POWER3_C0_27
PM_LINK_STACK_FULL
Link register stack is full
- POWER3_C0_28
PM_CBR_RESOLV_DISP
A conditional branch was resolved at dispatch
- POWER3_C0_29
PM_LD_CMPL_BF_AT_GC
Numbr of loads in the completion buffer at global cancel
- POWER3_C0_30
PM_ENTRY_CMPL_BF
Number of entries in the completion buffer
- POWER3_C0_32
PM_BIU_ST_RTRY6xx
6xx master transaction retried on bus for store op
- POWER3_C0_33
PM_EIEIO_WT_ST
Number of cycles EIEIO stalls a store
- POWER3_C0_35
PM_I=1_ST_TO_BUS
Number of I=1 store operations to bus
- POWER3_C0_36
PM_CRB_BUSY_ENT
Number of CRB busy block entries
- POWER3_C0_37
PM_DC_PREF_STREAM_ALLOC_BLK
Number of D-cache prefetch data stream allocatons blocked due to four stream
- POWER3_C0_38
PM_W=1_ST
Number of W=1 accesses (store)
- POWER3_C0_39
PM_LD_CI
Number of cache inhibit (I=1) loads
- POWER3_C0_40
PM_4MISS
Number of cycles with 4 outstanding misses
- POWER3_C0_41
PM_ST_GATH_BYTES
Number of store bytes gathered
- POWER3_C0_42
PM_DC_HIT_UNDER_MISS
Number of D-cache hit under misses (max of 2/cycles)
- POWER3_C0_43
PM_INTLEAVE_CONFL_STALLS
Number of cycles a store stalls due to interleave conflict or other resource
conflicts
- POWER3_C0_44
PM_DU1_REQ_ST_ADDR_XTION_DU1
A store address translation was requested from DU1
- POWER3_C0_45
PM_BTC/BTL_BLK
Number of cycles branch-to-count/branch-to-link is blocked from dispatch
- POWER3_C0_46
PM_FPU_SUCCESS_OOO_INST_SCHE
Number of FPU successful out-of-order instruction scheduling to both FPU units
- POWER3_C0_47
PM_FPU_LD/ST_ISSUES
Number of FPU loads and stores issued by LSU to DU
- POWER3_C0_48
PM_FPU_EXEC_FPSCR_FPU
FPU exceeded an FPSCR (count both FPUs)
- POWER3_C0_49
PM_FPU0_EXEC_FSQRT_FPU0
FPU0 executed an FSQRT instruction
- POWER3_C0_50
PM_FPU0_EXEC_ESTIMATE_FPU0
FPU0 executed Estimate instructions, FRSQRTE, FRES
- Counter 2 counts:
- POWER3_C1_0
PM_INST_CMPL
Number of instructions completed
- POWER3_C1_1
PM_CYC
Processor clock cycles
- POWER3_C1_2
PM_TB_BIT_TRANS
Time Base bit transition
- POWER3_C1_3
PM_INST_DISP
Number of instructions dispatched (Max 4 per cycle)
- POWER3_C1_4
PM_SNOOP_L2ACC
Snooped operation which accesses L2
- POWER3_C1_5
PM_DU0_REQ_ADDR_XTION_DU0
A store address translation was requested from DU0
- POWER3_C1_6
PM_TAG_BURSTRD_L2MISS
L2 miss caused by tagged burst read
- POWER3_C1_7
PM_FPU_IQ_FULL
Number of cycles the FPU instruction queue is full
- POWER3_C1_8
PM_BR_PRED
A conditional branch was predicted
- POWER3_C1_9
PM_ST_MISS
Store miss occurred in L1
- POWER3_C1_10
PM_LD_MISS_EXCEED_L2
Thresholder counting a tagged load (with L2 intervention)
- POWER3_C1_11
PM_L2ACC_BY_RWITM
RWITM caused an L2 access
- POWER3_C1_12
PM_ST_MISS_EXCEED_L2
Store data cache misses that exceeded threshold with lateral L2 cache
intervention
- POWER3_C1_13
PM_ST_COND_FAIL
Store conditional (stcx) instruction failed
- POWER3_C1_14
PM_CI_STORE_WAIT_CI_STORE
Number of cycles a cache-inhibited store waited on a cache-inhibited store
- POWER3_C1_15
PM_CHAIN_2_TO_1
Chain counter History Mode with PMC2[msb] chained to PMC1[lsb]
- POWER3_C1_16
PM_TAG_BURSTRD_L2MISS_W_INT
Tagged L2 burst read miss and another processor has a modified copy
- POWER3_C1_17
PM_FXU2_IDLE
FXU2 idle
- POWER3_C1_18
PM_SC_INST
Number of system calls
- POWER3_C1_19
PM_DSLB_MISS
D-cache SLB miss occurred
- POWER3_C1_20
PM_2CASTOUT_BF
Number of cycles 2 and only 2 store buffers are occupied
- POWER3_C1_21
PM_BIU_LD_NORTRY
Master generated load operation is not retried
- POWER3_C1_22
PM_RESRV_RQ
Number of larx executed (non speculative)
- POWER3_C1_23
PM_SNOOP_E_TO_S
Number of snoop-based L2 transitions from E to S
- POWER3_C1_25
PM_IBUF_EMPTY
Instruction buffer empty this cycle
- POWER3_C1_26
PM_SYNC_CYC
Number of cycles a sync instruction is at the bottom of the completion buffer
- POWER3_C1_27
PM_TLBSYNC_CYC
Number of cycles a tlbsync instruction is at the bottom of the completion
buffer
- POWER3_C1_28
PM_DC_PREF_L2_INV
Number of D-cache lines invalidated in L2 due to a prefetch load data
- POWER3_C1_29
PM_DC_PREF_FILT_1STR
Number of cycles D-cache prefetch filter has 1 and only 1 stream entry
- POWER3_C1_30
PM_ST_CI_PREGATH
Number of I=1 stores (before gathering)
- POWER3_C1_31
PM_ST_GATH_HW
Number of store halfword gathered
- POWER3_C1_32
PM_LD_WT_ADDR_CONF
Number of cycles load stalls due to interleave conflict
- POWER3_C1_33
PM_TAG_LD_DATA_RECV
LSU1 received data from memory side
- POWER3_C1_34
PM_FPU1_DENORM
FPU1 received denormalized data
- POWER3_C1_35
PM_FPU1_CMPL
FPU1 produced a result
- POWER3_C1_36
PM_FPU_FEST
FPU executed Estimate instructions FRSQRTE, FRES (count both FPUs)
- POWER3_C1_37
PM_FPU_LD
Number of FPU loads issued by the LSU to the DU
- POWER3_C1_38
PM_FPU0_FDIV
FPU0 executed a divide
- POWER3_C1_39
PM_FPU0_FPSCR
FPU0 executed an FPSCR
- Counter 3 counts:
- POWER3_C2_0
PM_IC_MISS_USED
An icache miss line was brought in and used
- POWER3_C2_1
PM_CYC
Processor clock cycles
- POWER3_C2_2
PM_INST_CMPL
Number of instructions completed per cycle
- POWER3_C2_3
PM_TB_BIT_TRANS
Selected Time Base outputs
- POWER3_C2_4
PM_INST_DISP
Number of instructions dispatched (max. 4 per cycle)
- POWER3_C2_5
PM_LD_MISS_L1
A load miss occured in L1
- POWER3_C2_6
PM_TAG_ST_L2MISS
Tagged RWITM caused L2 miss
- POWER3_C2_7
PM_BRQ_FILLED_CYC
Number of cycles the branch queue is full
- POWER3_C2_8
PM_TAG_ST_L2MISS_W_INT
Tagged L2 RWITM miss, another processor has a modified copy
- POWER3_C2_9
PM_ST_CMPL
Number of store instructions completed
- POWER3_C2_10
PM_TAG_ST_CMPL
Number of tagged stores completed
- POWER3_C2_11
PM_LD_NEXT
LOad instruction is at the bottom of the completion buffer
- POWER3_C2_12
PM_ST_L2MISS
RWITM caused L2 miss
- POWER3_C2_13
PM_TAG_BURSTRD_L2ACC
Tagged burst read caused L2 access
- POWER3_C2_14
PM_CI_ST_WT_CI_ST
Number of cycles a cache-inhibited store waited on a cache-inhibited store
- POWER3_C2_15
PM_CHAIN_3_TO_2
Chain counter History Mode with PMC3[msb] chanied to PMC2[lsb]
- POWER3_C2_16
PM_UNALIGNED_ST
Number of unaligned stores (one occurence per valid unaligned store AGEN)
- POWER3_C2_17
PM_CORE_ST_N_COPYBACK
Number of all core-originated stores and copybacks
- POWER3_C2_18
PM_SYNC_RERUN
Number of sync rerun operations initiated by the master
- POWER3_C2_19
PM_3CASTOUT_BF
Number of cycles 3 and only 3 store buffers are occupied
- POWER3_C2_20
PM_BIU_RETRY_DU_LOST_RES
Number of time BIU sends a retry but DU already lost reservation (I=1 only)
- POWER3_C2_21
PM_SNOOP_L2_E_OR_S_TO_I
Number of snoop-based L2 transitions from E or S to I
- POWER3_C2_22
PM_FPU_FDIV
FPU divides executed (count both FPUs)
- POWER3_C2_24
PM_IO_INTERPT
Number of I/O interrupts detected
- POWER3_C2_25
PM_DC_PREF_HIT
Number of D-cache prefetch request and data in prefetch buffer
- POWER3_C2_26
PM_DC_PREF_FILT_2STR
Number of cycles D-cache prefetch filter has 2 and only 2 stream entries
- POWER3_C2_27
PM_PREF_MATCH_DEM_MISS
Prefetch matches a demand miss
- POWER3_C2_28
PM_LSU1_IDLE
LSU1 idle
- Counter 4 counts:
- POWER3_C3_1
PM_CYC
Processor clock cycles
- POWER3_C3_2
PM_INST_CMPL
Number of instructions completed
- POWER3_C3_3
PM_TB_BIT_TRANS
Selected Time Base outputs
- POWER3_C3_4
PM_INST_DISP
Number of instructions dispatched (Max 4 per cycle)
- POWER3_C3_5
PM_LD_CMPL
Number of load instructions completed (max 4 per cycle)
- POWER3_C3_6
PM_FPU0_DENORM
FPU0 received denormalized data
- POWER3_C3_7
PM_TAG_LD_DC
LSU0 issued a tagged load request to D-cache
- POWER3_C3_8
PM_TAG_ST_L2ACC
Tagged RWITM caused L2 access
- POWER3_C3_9
PM_LSU0_LD_DATA
LSU0 received data from memory side (L1/L2/6xx)
- POWER3_C3_10
PM_ST_L2MISS_W_INT
L2 RWITM miss, another processor has modified copy
- POWER3_C3_11
PM_SYNC
Sync request was made to the BIU
- POWER3_C3_13
PM_FXU2_BUSY
FXU2 was busy executing an instruction
- POWER3_C3_14
PM_BIU_ST_NORTRY
Master generated store operation is not retried
- POWER3_C3_15
PM_CHAIN_4_TO_3
Chain counter History Mode with PMC4[msb] chained to PMC3[lsb]
- POWER3_C3_16
PM_DC_ALIAS_HIT
ECAM/RCAM logic detected an aliased hit
- POWER3_C3_17
PM_FXU1_IDLE
FXU1 idle
- POWER3_C3_18
PM_UNALIGNED_LD
Number of unaligned loads (one occurence per valid load AGEN)
- POWER3_C3_19
PM_CMPLU_WT_LD
Completion unit is stalled on load operations
- POWER3_C3_20
PM_BIU_ARI_RTRY
A master-generated Bus operation received an ARespIn (ARI) retry
- POWER3_C3_21
PM_FPU_FSQRT
Number of FPU FSQRT executed (count both FPUs)
- POWER3_C3_22
PM_BR_CMPL
Branch completed
- POWER3_C3_23
PM_DISP_BF_EMPTY
Dispatch buffer is empty this cycle
- POWER3_C3_24
PM_LNK_REG_STACK_ERR
Link register stack error
- POWER3_C3_25
PM_CRLU_PROD_RES
CR logical unit produced a result
- POWER3_C3_26
PM_TLBSYNC_RERUN
Number of tlbsync rerun operations initiated by the master
- POWER3_C3_27
PM_SNOOP_L2_M_TO_E_OR_S
Number of snoop-based L2 transition from M to E or S
- POWER3_C3_29
PM_DEM_FETCH_WT_PREF
Number of demand fetch blocked by outstanding prefetch
- POWER3_C3_30
PM_FPU0_EXEC_FRSP/FCONV
FPU0 executed FRSP or FCONV
- Counter 5 counts:
- POWER3_C4_1
PM_IC_HIT
The IC was accessed and a block was fetched
- POWER3_C4_2
PM_0INST_CMPL
No instructions were completed
- POWER3_C4_3
PM_FPU_DENORM
FPU sent denormalized data (count both FPUs)
- POWER3_C4_4
PM_BURSTRD_L2ACC
Burst read caused L2 access
- POWER3_C4_5
PM_FPU0_CMPL
FPU0 produced a result
- POWER3_C4_6
PM_LSU_IDLE
LSU idle (count both LSUs)
- POWER3_C4_7
PM_BTAC_HITS
Number of hits in the BTAC
- POWER3_C4_8
PM_STQ_FULL
Store queue is full
- POWER3_C4_9
PM_BIU_WT_ST_BF
A master-generated store operation is stalled waiting for a store buffer
- POWER3_C4_10
PM_SNOOP_L2_M_TO_I
Number of snoop-based L2 transitions from M to I
- POWER3_C4_11
PM_FRSP/FCONV_EXEC
Float FRSP or FCONV executed (count both FPUs)
- POWER3_C4_12
PM_CYC
Processor clock cycles
- POWER3_C4_13
PM_BIU_ASI_RTRY
A master-generated bus operation received a AStatIn (ASI) Retry
- POWER3_C4_15
PM_CHAIN_5_TO_4
Chain Counter History mode with PMC5[msb] chained to PMC4[lsb]
- POWER3_C4_16
PM_DC_REQ_HIT_PREF_BUF
Number of D-cache request hit on prefetch buffer
- POWER3_C4_17
PM_DC_PREF_FILT_3STR
Number of cycles D-cache prefetch filter has 3 and only 3 stream entries
- POWER3_C4_18
PM_3MISS
Number of cycles D-cache with 3 and only 3 outstanding misses
- POWER3_C4_19
PM_ST_GATH_WORD
Number of Word gathered (store)
- POWER3_C4_20
PM_LD_WT_ST_CONF
Number of cycles load stalls due to store conflict
- POWER3_C4_21
PM_LSU1_ISS_TAG_ST
LSU1 issued a tagged store request to D-cache
- POWER3_C4_22
PM_FPU1_BUSY
FPU1 was busy
- POWER3_C4_23
PM_FPU0_FMOV_FEST
FPU0 executed MOVE, or EST, or FSEL
- POWER3_C4_24
PM_4CASTOUT_BUF
Number of cycles 4 and only 4 castout push buffers used
- Counter 6 counts:
- POWER3_C5_0
PM_DSLB_MISS
D-cache SLB miss occured
- POWER3_C5_1
PM_ST_L1HIT
A store hit occured in L1
- POWER3_C5_2
PM_FXU2_PROD_RESULT
FXU2 produced a result
- POWER3_C5_3
PM_BTAC_MISS
A BTAC miss was detected
- POWER3_C5_5
PM_CBR_DISP
A conditional branch was dispatched
- POWER3_C5_6
PM_LQ_FULL
Miss (load) queue is full
- POWER3_C5_8
PM_SNOOP_PUSH_INT
Number of snoop pushes and interventions
- POWER3_C5_9
PM_EE_OFF_EXT_INT_MSR
EE bit os off and an external interrupt is pending
- POWER3_C5_10
PM_BIU_LD_RTRY
A master generated load operation is retried
- POWER3_C5_11
PM_FPU_EXE_FCMP
Float FCMP executed (count both FPUs)
- POWER3_C5_12
PM_CYC
Processor clock cycles
- POWER3_C5_13
PM_DC_PREF_BF_INV
Number of D-cache prefetch buffer invalidates
- POWER3_C5_14
PM_DC_PREF_FILT_4STR
Number of cycles D-cache prefetch filter has 4 and only 4 stream entries
- POWER3_C5_15
PM_CHAIN_6_TO_5
Chain counter History Mode with PMC6[msb] chained to PMC5[lsb]
- POWER3_C5_16
PM_1MISS
Number of cycles with 1 and only 1 outstanding miss
- POWER3_C5_17
PM_ST_GATH_DW
Number of Doubleword gathered (stored)
- POWER3_C5_18
PM_LSU1_ISS_TAG_LD_LSU1
LSU1 issued a tagged load request to D-cache
- POWER3_C5_19
PM_FPU1_IDLE
FPU1 idle
- POWER3_C5_20
PM_FPU0_FMA
FPU0 executed a Multiply-Add
- POWER3_C5_21
PM_SNOOP_PUSH_BUF
Number of cycles snoop push buffer used
- Counter 7 counts:
- POWER3_C6_0
PM_IC_MISS
L1 I-cache misses
- POWER3_C6_1
PM_FXU0_PROD_RESULT
FXU0 produced a result
- POWER3_C6_2
PM_BR_DISP
Instrs dispatched to the branch unit
- POWER3_C6_3
PM_MPRED_BR_CAUSED_GC
Global cancel due to branch guessed wrong
- POWER3_C6_4
PM_SNOOP
Snoop requests received
- POWER3_C6_6
PM_0INST_DISP
No instructions were dipatched
- POWER3_C6_7
PM_FXU_IDLE
Number of cycles the FXU units are idle
- POWER3_C6_8
PM_6XX_RTRY_CHNG_TRTP
Bus retried transaction that change transaction type
- POWER3_C6_9
PM_EXEC_FMA
Float Multiply-Adds executed (count both FPUs)
- POWER3_C6_10
PM_ST_DISP
Number of store instructions were dispatched
- POWER3_C6_11
PM_CYC
Processor clock cycles
- POWER3_C6_12
PM_TLBSYNC_CMPLBF
Number of cycles a tlbsync instruction is at the bottom of the completion
buffer
- POWER3_C6_14
PM_DC_PREF_L2HIT
Number of D-cache prefetch request and data in L2
- POWER3_C6_15
PM_CHAIN_7_TO_6
Chain Counter History Mode with PMC7[msb] chained to PMC6[lsb]
- POWER3_C6_16
PM_DC_PREF_BLOCK_DEMAND_MISS
Number of cycles demand miss blocked with 1 or more prefetches outstanding
- POWER3_C6_17
PM_2MISS
Number of cycles with 2 and only 2 outstanding misses
- POWER3_C6_18
PM_DC_PREF_USED
Number of D-cache prefetch and used
- POWER3_C6_19
PM_LSU_WT_SNOOP_BUSY
Number of cycles load/store stall due to snoop busy
- POWER3_C6_20
PM_IC_PREF_USED
Number of I prefetch miss in progress changed to a normal, non-prefetch
- POWER3_C6_22
PM_FPU0_FADD_FCMP_GMUL
FPU0 executed an Add, Compare, Multiply, Subtract
- POWER3_C6_23
PM_1WT_THRU_BUF_USED
Number of cycles 1 write-through buffer used
- Counter 8 counts:
- POWER3_C7_0
PM_TLB_MISS
TLB misses. Includes both D-cache and I-cache misses
- POWER3_C7_1
PM_SNOOP_L2HIT
Snoop hit occured and L2 has the valid block
- POWER3_C7_2
PM_BURSTRD_L2MISS
A burst read caused L2 miss
- POWER3_C7_3
PM_RESRV_CMPL
Store conditional (stcx) instruction executed successfully
- POWER3_C7_4
PM_FXU1_PROD_RESULT
FXU1 produced a result
- POWER3_C7_5
PM_RETRY_BUS_OP
Retry 6xx bus operation
- POWER3_C7_6
PM_FPU_IDLE
FPU idle (count both FPUs)
- POWER3_C7_7
PM_FETCH_CORR_AT_DISPATCH
Fetch corrections made at dispatch stage
- POWER3_C7_8
PM_CMPLU_WT_ST
Completion unit is stalled on store operations
- POWER3_C7_9
PM_FPU_FADD_FMUL
Float Add, Multiply, Subtract executed (count both FPUs)
- POWER3_C7_10
PM_LD_DISP
Number of load instructions dispatched (lm and lst counted as 1)
- POWER3_C7_11
PM_ALIGN_INT
An alignment interrupt was executed
- POWER3_C7_12
PM_CYC
Processor clock cycles
- POWER3_C7_13
PM_SYNC_CMPL_BF_CYC
Number of cycles a sync instruction is at the bottom of the completion buffer
- POWER3_C7_14
PM_2WT_THRU_NUF_USED
Number of cycles 2 write-through buffer used
- POWER3_C7_15
PM_CHAIN_8_TO_7
Chain counter History Mode with PMC8[msb] chained to PMC6[lsb]
The POWER3-II has 8 performance counters. Missing counter/event
pairs mean an unused event for that counter. To be consistent with the
numbering scheme with start numbering with POWER3II_C0_xx for counter
1.
- Counter 1 counts:
- POWER3II_C0_0
PM_CYC
Processor clock cycles
- POWER3II_C0_1
PM_INST_CMPL
Number of instructions completed
- POWER3II_C0_2
PM_TB_BIT_TRANS
Selected Time Base output
- POWER3II_C0_3
PM_INST_DISP
Number of instructions dispatched
- POWER3II_C0_4
PM_LD_CMPL
Number of load instructions completed (max. 4 per cycle)
- POWER3II_C0_5
PM_IC_MISS
L1 I-cache miss
- POWER3II_C0_6
PM_LD_MISS_L2HIT
A load miss occured in L1
- POWER3II_C0_7
PM_LD_MISS_EXCEED_NO_L2
Thresholder counting tagged loads (no L2 intervention)
- POWER3II_C0_9
PM_ST_MISS_EXCEED_NO_L2
Thresholder counting a tagged store (no L2 intervention)
- POWER3II_C0_10
PM_BURSTRD_L2MISS_W_INT
L2 burst read miss & another processor has a modified copy
- POWER3II_C0_12
PM_PM_IC_MISS_USED
An icache miss line was brought in and used
- POWER3II_C0_13
PM_DU_ECAM/RCAM_OFFSET_HIT
The ECAM/RCAM logic detected an offset hit from DU
- POWER3II_C0_14
PM_GLOBAL_CANCEL_INST_DEL
Number of instructions deleted on global cancel
- POWER3II_C0_15
PM_CHAIN_1_TO_8
Chain counter History Mode with PMC1[msb] chained to PMC[lsb]
- POWER3II_C0_16
PM_FPU0_BUSY
Floating Point Unit 0 busy
- POWER3II_C0_17
PM_DSLB_MISS
D-cache SLB miss occured
- POWER3II_C0_18
PM_TAG_ST_DISP_LSU0
LSU0 issued a tagged store request to D-cache
- POWER3II_C0_19
PM_TLB_MISS
TLB miss. Includes both D-cache and I-cache misses
- POWER3II_C0_20
PM_EE_OFF
The MSR EE bit is off
- POWER3II_C0_21
PM_BRU_IDLE
Branch Unit is idle
- POWER3II_C0_22
PM_SYNCHRO_INST
A single instruction serialization is executing
- POWER3II_C0_24
PM_CYC_1STBUF_OCCP
Number of cycles 1 and only 1 store buffer is occupied
- POWER3II_C0_25
PM_SNOOP_L1_M_TO_E_OR_S
Number of snoop based L1 transitions from M to E or S
- POWER3II_C0_26
PM_ST_CMPL_BF_AT_GC
Number of stores in the completion bffer at global cancel
- POWER3II_C0_27
PM_LINK_STACK_FULL
Link register stack is full
- POWER3II_C0_28
PM_CBR_RESOLV_DISP
A conditional branch was resolved at dispatch
- POWER3II_C0_29
PM_LD_CMPL_BF_AT_GC
Numbr of loads in the completion buffer at global cancel
- POWER3II_C0_30
PM_ENTRY_CMPL_BF
Number of entries in the completion buffer
- POWER3II_C0_32
PM_BIU_ST_RTRY6xx
6xx master transaction retried on bus for store op
- POWER3II_C0_33
PM_EIEIO_WT_ST
Number of cycles EIEIO stalls a store
- POWER3II_C0_35
PM_I=1_ST_TO_BUS
Number of I=1 store operations to bus
- POWER3II_C0_36
PM_CRB_BUSY_ENT
Number of CRB busy block entries
- POWER3II_C0_37
PM_DC_PREF_STREAM_ALLOC_BLK
Number of D-cache prefetch data stream allocatons blocked due to four stream
- POWER3II_C0_38
PM_W=1_ST
Number of W=1 accesses (store)
- POWER3II_C0_39
PM_LD_CI
Number of cache inhibit (I=1) loads
- POWER3II_C0_40
PM_4MISS
Number of cycles with 4 outstanding misses
- POWER3II_C0_41
PM_ST_GATH_BYTES
Number of store bytes gathered
- POWER3II_C0_42
PM_DC_HIT_UNDER_MISS
Number of D-cache hit under misses (max of 2/cycles)
- POWER3II_C0_43
PM_INTLEAVE_CONFL_STALLS
Number of cycles a store stalls due to interleave conflict or other resource
conflicts
- POWER3II_C0_44
PM_DU1_REQ_ST_ADDR_XTION_DU1
A store address translation was requested from DU1
- POWER3II_C0_45
PM_BTC/BTL_BLK
Number of cycles branch-to-count/branch-to-link is blocked from dispatch
- POWER3II_C0_46
PM_FPU_SUCCESS_OOO_INST_SCHE
Number of FPU successful out-of-order instruction scheduling to both FPU units
- POWER3II_C0_47
PM_FPU_LD/ST_ISSUES
Number of FPU loads and stores issued by LSU to DU
- POWER3II_C0_48
PM_FPU_EXEC_FPSCR_FPU
FPU exceeded an FPSCR (count both FPUs)
- POWER3II_C0_49
PM_FPU0_EXEC_FSQRT_FPU0
FPU0 executed an FSQRT instruction
- POWER3II_C0_50
PM_FPU0_EXEC_ESTIMATE_FPU0
FPU0 executed Estimate instructions, FRSQRTE, FRES
- Counter 2 counts:
- POWER3II_C1_0
PM_INST_CMPL
Number of instructions completed
- POWER3II_C1_1
PM_CYC
Processor clock cycles
- POWER3II_C1_2
PM_TB_BIT_TRANS
Time Base bit transition
- POWER3II_C1_3
PM_INST_DISP
Number of instructions dispatched (Max 4 per cycle)
- POWER3II_C1_4
PM_SNOOP_L2ACC
Snooped operation which accesses L2
- POWER3II_C1_5
PM_DU0_REQ_ADDR_XTION_DU0
A store address translation was requested from DU0
- POWER3II_C1_6
PM_TAG_BURSTRD_L2MISS
L2 miss caused by tagged burst read
- POWER3II_C1_7
PM_FPU_IQ_FULL
Number of cycles the FPU instruction queue is full
- POWER3II_C1_8
PM_BR_PRED
A conditional branch was predicted
- POWER3II_C1_9
PM_ST_MISS
Store miss occurred in L1
- POWER3II_C1_10
PM_LD_MISS_EXCEED_L2
Thresholder counting a tagged load (with L2 intervention)
- POWER3II_C1_11
PM_L2ACC_BY_RWITM
RWITM caused an L2 access
- POWER3II_C1_12
PM_ST_MISS_EXCEED_L2
Store data cache misses that exceeded threshold with lateral L2 cache
intervention
- POWER3II_C1_13
PM_ST_COND_FAIL
Store conditional (stcx) instruction failed
- POWER3II_C1_14
PM_CI_STORE_WAIT_CI_STORE
Number of cycles a cache-inhibited store waited on a cache-inhibited store
- POWER3II_C1_15
PM_CHAIN_2_TO_1
Chain counter History Mode with PMC2[msb] chained to PMC1[lsb]
- POWER3II_C1_16
PM_TAG_BURSTRD_L2MISS_W_INT
Tagged L2 burst read miss and another processor has a modified copy
- POWER3II_C1_17
PM_FXU2_IDLE
FXU2 idle
- POWER3II_C1_18
PM_SC_INST
Number of system calls
- POWER3II_C1_19
PM_DSLB_MISS
D-cache SLB miss occurred
- POWER3II_C1_20
PM_2CASTOUT_BF
Number of cycles 2 and only 2 store buffers are occupied
- POWER3II_C1_21
PM_BIU_LD_NORTRY
Master generated load operation is not retried
- POWER3II_C1_22
PM_RESRV_RQ
Number of larx executed (non speculative)
- POWER3II_C1_23
PM_SNOOP_E_TO_S
Number of snoop-based L2 transitions from E to S
- POWER3II_C1_25
PM_IBUF_EMPTY
Instruction buffer empty this cycle
- POWER3II_C1_26
PM_SYNC_CYC
Number of cycles a sync instruction is at the bottom of the completion buffer
- POWER3II_C1_27
PM_TLBSYNC_CYC
Number of cycles a tlbsync instruction is at the bottom of the completion
buffer
- POWER3II_C1_28
PM_DC_PREF_L2_INV
Number of D-cache lines invalidated in L2 due to a prefetch load data
- POWER3II_C1_29
PM_DC_PREF_FILT_1STR
Number of cycles D-cache prefetch filter has 1 and only 1 stream entry
- POWER3II_C1_30
PM_ST_CI_PREGATH
Number of I=1 stores (before gathering)
- POWER3II_C1_31
PM_ST_GATH_HW
Number of store halfword gathered
- POWER3II_C1_32
PM_LD_WT_ADDR_CONF
Number of cycles load stalls due to interleave conflict
- POWER3II_C1_33
PM_TAG_LD_DATA_RECV
LSU1 received data from memory side
- POWER3II_C1_34
PM_FPU1_DENORM
FPU1 received denormalized data
- POWER3II_C1_35
PM_FPU1_CMPL
FPU1 produced a result
- POWER3II_C1_36
PM_FPU_FEST
FPU executed Estimate instructions FRSQRTE, FRES (count both FPUs)
- POWER3II_C1_37
PM_FPU_LD
Number of FPU loads issued by the LSU to the DU
- POWER3II_C1_38
PM_FPU0_FDIV
FPU0 executed a divide
- POWER3II_C1_39
PM_FPU0_FPSCR
FPU0 executed an FPSCR
- Counter 3 counts:
- POWER3II_C2_0
PM_IC_MISS_USED
An icache miss line was brought in and used
- POWER3II_C2_1
PM_CYC
Processor clock cycles
- POWER3II_C2_2
PM_INST_CMPL
Number of instructions completed per cycle
- POWER3II_C2_3
PM_TB_BIT_TRANS
Selected Time Base outputs
- POWER3II_C2_4
PM_INST_DISP
Number of instructions dispatched (max. 4 per cycle)
- POWER3II_C2_5
PM_LD_MISS_L1
A load miss occured in L1
- POWER3II_C2_6
PM_TAG_ST_L2MISS
Tagged RWITM caused L2 miss
- POWER3II_C2_7
PM_BRQ_FILLED_CYC
Number of cycles the branch queue is full
- POWER3II_C2_8
PM_TAG_ST_L2MISS_W_INT
Tagged L2 RWITM miss, another processor has a modified copy
- POWER3II_C2_9
PM_ST_CMPL
Number of store instructions completed
- POWER3II_C2_10
PM_TAG_ST_CMPL
Number of tagged stores completed
- POWER3II_C2_11
PM_LD_NEXT
LOad instruction is at the bottom of the completion buffer
- POWER3II_C2_12
PM_ST_L2MISS
RWITM caused L2 miss
- POWER3II_C2_13
PM_TAG_BURSTRD_L2ACC
Tagged burst read caused L2 access
- POWER3II_C2_14
PM_CI_ST_WT_CI_ST
Number of cycles a cache-inhibited store waited on a cache-inhibited store
- POWER3II_C2_15
PM_CHAIN_3_TO_2
Chain counter History Mode with PMC3[msb] chanied to PMC2[lsb]
- POWER3II_C2_16
PM_UNALIGNED_ST
Number of unaligned stores (one occurence per valid unaligned store AGEN)
- POWER3II_C2_17
PM_CORE_ST_N_COPYBACK
Number of all core-originated stores and copybacks
- POWER3II_C2_18
PM_SYNC_RERUN
Number of sync rerun operations initiated by the master
- POWER3II_C2_19
PM_3CASTOUT_BF
Number of cycles 3 and only 3 store buffers are occupied
- POWER3II_C2_20
PM_BIU_RETRY_DU_LOST_RES
Number of time BIU sends a retry but DU already lost reservation (I=1 only)
- POWER3II_C2_21
PM_SNOOP_L2_E_OR_S_TO_I
Number of snoop-based L2 transitions from E or S to I
- POWER3II_C2_22
PM_FPU_FDIV
FPU divides executed (count both FPUs)
- POWER3II_C2_24
PM_IO_INTERPT
Number of I/O interrupts detected
- POWER3II_C2_25
PM_DC_PREF_HIT
Number of D-cache prefetch request and data in prefetch buffer
- POWER3II_C2_26
PM_DC_PREF_FILT_2STR
Number of cycles D-cache prefetch filter has 2 and only 2 stream entries
- POWER3II_C2_27
PM_PREF_MATCH_DEM_MISS
Prefetch matches a demand miss
- POWER3II_C2_28
PM_LSU1_IDLE
LSU1 idle
- Counter 4 counts:
- POWER3II_C3_1
PM_CYC
Processor clock cycles
- POWER3II_C3_2
PM_INST_CMPL
Number of instructions completed
- POWER3II_C3_3
PM_TB_BIT_TRANS
Selected Time Base outputs
- POWER3II_C3_4
PM_INST_DISP
Number of instructions dispatched (Max 4 per cycle)
- POWER3II_C3_5
PM_LD_CMPL
Number of load instructions completed (max 4 per cycle)
- POWER3II_C3_6
PM_FPU0_DENORM
FPU0 received denormalized data
- POWER3II_C3_7
PM_TAG_LD_DC
LSU0 issued a tagged load request to D-cache
- POWER3II_C3_8
PM_TAG_ST_L2ACC
Tagged RWITM caused L2 access
- POWER3II_C3_9
PM_LSU0_LD_DATA
LSU0 received data from memory side (L1/L2/6xx)
- POWER3II_C3_10
PM_ST_L2MISS_W_INT
L2 RWITM miss, another processor has modified copy
- POWER3II_C3_11
PM_SYNC
Sync request was made to the BIU
- POWER3II_C3_13
PM_FXU2_BUSY
FXU2 was busy executing an instruction
- POWER3II_C3_14
PM_BIU_ST_NORTRY
Master generated store operation is not retried
- POWER3II_C3_15
PM_CHAIN_4_TO_3
Chain counter History Mode with PMC4[msb] chained to PMC3[lsb]
- POWER3II_C3_16
PM_DC_ALIAS_HIT
ECAM/RCAM logic detected an aliased hit
- POWER3II_C3_17
PM_FXU1_IDLE
FXU1 idle
- POWER3II_C3_18
PM_UNALIGNED_LD
Number of unaligned loads (one occurence per valid load AGEN)
- POWER3II_C3_19
PM_CMPLU_WT_LD
Completion unit is stalled on load operations
- POWER3II_C3_20
PM_BIU_ARI_RTRY
A master-generated Bus operation received an ARespIn (ARI) retry
- POWER3II_C3_21
PM_FPU_FSQRT
Number of FPU FSQRT executed (count both FPUs)
- POWER3II_C3_22
PM_BR_CMPL
Branch completed
- POWER3II_C3_23
PM_DISP_BF_EMPTY
Dispatch buffer is empty this cycle
- POWER3II_C3_24
PM_LNK_REG_STACK_ERR
Link register stack error
- POWER3II_C3_25
PM_CRLU_PROD_RES
CR logical unit produced a result
- POWER3II_C3_26
PM_TLBSYNC_RERUN
Number of tlbsync rerun operations initiated by the master
- POWER3II_C3_27
PM_SNOOP_L2_M_TO_E_OR_S
Number of snoop-based L2 transition from M to E or S
- POWER3II_C3_29
PM_DEM_FETCH_WT_PREF
Number of demand fetch blocked by outstanding prefetch
- POWER3II_C3_30
PM_FPU0_EXEC_FRSP/FCONV
FPU0 executed FRSP or FCONV
- Counter 5 counts:
- POWER3II_C4_1
PM_IC_HIT
The IC was accessed and a block was fetched
- POWER3II_C4_2
PM_0INST_CMPL
No instructions were completed
- POWER3II_C4_3
PM_FPU_DENORM
FPU sent denormalized data (count both FPUs)
- POWER3II_C4_4
PM_BURSTRD_L2ACC
Burst read caused L2 access
- POWER3II_C4_5
PM_FPU0_CMPL
FPU0 produced a result
- POWER3II_C4_6
PM_LSU_IDLE
LSU idle (count both LSUs)
- POWER3II_C4_7
PM_BTAC_HITS
Number of hits in the BTAC
- POWER3II_C4_8
PM_STQ_FULL
Store queue is full
- POWER3II_C4_9
PM_BIU_WT_ST_BF
A master-generated store operation is stalled waiting for a store buffer
- POWER3II_C4_10
PM_SNOOP_L2_M_TO_I
Number of snoop-based L2 transitions from M to I
- POWER3II_C4_11
PM_FRSP/FCONV_EXEC
Float FRSP or FCONV executed (count both FPUs)
- POWER3II_C4_12
PM_CYC
Processor clock cycles
- POWER3II_C4_13
PM_BIU_ASI_RTRY
A master-generated bus operation received a AStatIn (ASI) Retry
- POWER3II_C4_15
PM_CHAIN_5_TO_4
Chain Counter History mode with PMC5[msb] chained to PMC4[lsb]
- POWER3II_C4_16
PM_DC_REQ_HIT_PREF_BUF
Number of D-cache request hit on prefetch buffer
- POWER3II_C4_17
PM_DC_PREF_FILT_3STR
Number of cycles D-cache prefetch filter has 3 and only 3 stream entries
- POWER3II_C4_18
PM_3MISS
Number of cycles D-cache with 3 and only 3 outstanding misses
- POWER3II_C4_19
PM_ST_GATH_WORD
Number of Word gathered (store)
- POWER3II_C4_20
PM_LD_WT_ST_CONF
Number of cycles load stalls due to store conflict
- POWER3II_C4_21
PM_LSU1_ISS_TAG_ST
LSU1 issued a tagged store request to D-cache
- POWER3II_C4_22
PM_FPU1_BUSY
FPU1 was busy
- POWER3II_C4_23
PM_FPU0_FMOV_FEST
FPU0 executed MOVE, or EST, or FSEL
- POWER3II_C4_24
PM_4CASTOUT_BUF
Number of cycles 4 and only 4 castout push buffers used
- Counter 6 counts:
- POWER3II_C5_0
PM_DSLB_MISS
D-cache SLB miss occured
- POWER3II_C5_1
PM_ST_L1HIT
A store hit occured in L1
- POWER3II_C5_2
PM_FXU2_PROD_RESULT
FXU2 produced a result
- POWER3II_C5_3
PM_BTAC_MISS
A BTAC miss was detected
- POWER3II_C5_5
PM_CBR_DISP
A conditional branch was dispatched
- POWER3II_C5_6
PM_LQ_FULL
Miss (load) queue is full
- POWER3II_C5_7
PM_6XXBUS _CMPL_LOAD
Instrunction load op completed on 6XX bus and bus op to receive instruction
- POWER3II_C5_8
PM_SNOOP_PUSH_INT
Number of snoop pushes and interventions
- POWER3II_C5_9
PM_EE_OFF_EXT_INT_MSR
EE bit os off and an external interrupt is pending
- POWER3II_C5_10
PM_BIU_LD_RTRY
A master generated load operation is retried
- POWER3II_C5_11
PM_FPU_EXE_FCMP
Float FCMP executed (count both FPUs)
- POWER3II_C5_12
PM_CYC
Processor clock cycles
- POWER3II_C5_13
PM_DC_PREF_BF_INV
Number of D-cache prefetch buffer invalidates
- POWER3II_C5_14
PM_DC_PREF_FILT_4STR
Number of cycles D-cache prefetch filter has 4 and only 4 stream entries
- POWER3II_C5_15
PM_CHAIN_6_TO_5
Chain counter History Mode with PMC6[msb] chained to PMC5[lsb]
- POWER3II_C5_16
PM_1MISS
Number of cycles with 1 and only 1 outstanding miss
- POWER3II_C5_17
PM_ST_GATH_DW
Number of Doubleword gathered (stored)
- POWER3II_C5_18
PM_LSU1_ISS_TAG_LD_LSU1
LSU1 issued a tagged load request to D-cache
- POWER3II_C5_19
PM_FPU1_IDLE
FPU1 idle
- POWER3II_C5_20
PM_FPU0_FMA
FPU0 executed a Multiply-Add
- POWER3II_C5_21
PM_SNOOP_PUSH_BUF
Number of cycles snoop push buffer used
- Counter 7 counts:
- POWER3II_C6_0
PM_IC_MISS
L1 I-cache misses
- POWER3II_C6_1
PM_FXU0_PROD_RESULT
FXU0 produced a result
- POWER3II_C6_2
PM_BR_DISP
Instrs dispatched to the branch unit
- POWER3II_C6_3
PM_MPRED_BR_CAUSED_GC
Global cancel due to branch guessed wrong
- POWER3II_C6_4
PM_SNOOP
Snoop requests received
- POWER3II_C6_6
PM_0INST_DISP
No instructions were dipatched
- POWER3II_C6_7
PM_FXU_IDLE
Number of cycles the FXU units are idle
- POWER3II_C6_8
PM_6XX_RTRY_CHNG_TRTP
Bus retried transaction that change transaction type
- POWER3II_C6_9
PM_EXEC_FMA
Float Multiply-Adds executed (count both FPUs)
- POWER3II_C6_10
PM_ST_DISP
Number of store instructions were dispatched
- POWER3II_C6_11
PM_CYC
Processor clock cycles
- POWER3II_C6_12
PM_TLBSYNC_CMPLBF
Number of cycles a tlbsync instruction is at the bottom of the completion
buffer
- POWER3II_C6_14
PM_DC_PREF_L2HIT
Number of D-cache prefetch request and data in L2
- POWER3II_C6_15
PM_CHAIN_7_TO_6
Chain Counter History Mode with PMC7[msb] chained to PMC6[lsb]
- POWER3II_C6_16
PM_DC_PREF_BLOCK_DEMAND_MISS
Number of cycles demand miss blocked with 1 or more prefetches outstanding
- POWER3II_C6_17
PM_2MISS
Number of cycles with 2 and only 2 outstanding misses
- POWER3II_C6_18
PM_DC_PREF_USED
Number of D-cache prefetch and used
- POWER3II_C6_19
PM_LSU_WT_SNOOP_BUSY
Number of cycles load/store stall due to snoop busy
- POWER3II_C6_20
PM_IC_PREF_USED
Number of I prefetch miss in progress changed to a normal, non-prefetch
- POWER3II_C6_22
PM_FPU0_FADD_FCMP_GMUL
FPU0 executed an Add, Compare, Multiply, Subtract
- POWER3II_C6_23
PM_1WT_THRU_BUF_USED
Number of cycles 1 write-through buffer used
- Counter 8 counts:
- POWER3II_C7_0
PM_TLB_MISS
TLB misses. Includes both D-cache and I-cache misses
- POWER3II_C7_1
PM_SNOOP_L2HIT
Snoop hit occured and L2 has the valid block
- POWER3II_C7_2
PM_BURSTRD_L2MISS
A burst read caused L2 miss
- POWER3II_C7_3
PM_RESRV_CMPL
Store conditional (stcx) instruction executed successfully
- POWER3II_C7_4
PM_FXU1_PROD_RESULT
FXU1 produced a result
- POWER3II_C7_5
PM_RETRY_BUS_OP
Retry 6xx bus operation
- POWER3II_C7_6
PM_FPU_IDLE
FPU idle (count both FPUs)
- POWER3II_C7_7
PM_FETCH_CORR_AT_DISPATCH
Fetch corrections made at dispatch stage
- POWER3II_C7_8
PM_CMPLU_WT_ST
Completion unit is stalled on store operations
- POWER3II_C7_9
PM_FPU_FADD_FMUL
Float Add, Multiply, Subtract executed (count both FPUs)
- POWER3II_C7_10
PM_LD_DISP
Number of load instructions dispatched (lm and lst counted as 1)
- POWER3II_C7_11
PM_ALIGN_INT
An alignment interrupt was executed
- POWER3II_C7_12
PM_CYC
Processor clock cycles
- POWER3II_C7_13
PM_SYNC_CMPL_BF_CYC
Number of cycles a sync instruction is at the bottom of the completion buffer
- POWER3II_C7_14
PM_2WT_THRU_NUF_USED
Number of cycles 2 write-through buffer used
- POWER3II_C7_15
PM_CHAIN_8_TO_7
Chain counter History Mode with PMC8[msb] chained to PMC6[lsb]
The Intel Pentium
is a
32-bit CISC microprocessor. The Pentium has 2 performance counters
with most of the events countable by either of the counters and only
some events countable only by a specific counter (as noted). With the
introduction of the MMX-extensions, Pentium's with MMX have defined
more events as stated (MMX-extensions). We have left out all
events which are specific to the MMX functional unit as compilers
normally do not generate code for this unit. The performance counters
are 40 bit wide, the time stamp counter is 64 bit wide.
The Time Stamp Counter counts the elapsed machine cycles:
- Pentium_TSC
elapsed machine cycles
The events countable by both counters are:
- Pentium_0
00H DATA_READ
Number of memory data read operations.
- Pentium_1
01H DATA_WRITE
Number of memory data write operations.
- Pentium_2
02H DATA_TLB_MISS
Number of misses to the data cache translation look-aside buffer.
- Pentium_3
03H DATA_READ_MISS
Number of memory read accesses that miss the internal data cache.
- Pentium_4
04H DATA_WRITE_MISS
Number of memory write accesses that miss the internal data cache.
- Pentium_5
05H WRITE_HIT_TO_M-_OR_E-STATE_LINES
Number of write hits to exclusive or modified lines in the data cache.
- Pentium_6
06H DATA_CACHE_LINES_WRITTEN_BACK
Number of dirty lines that are written back.
- Pentium_7
07H EXTERNAL_SNOOPS
Number of accepted external snoops.
- Pentium_8
08H EXTERNAL_DATA_CACHE_SNOOP_HITS
Number of external snoops to the data cache.
- Pentium_9
09H MEMORY ACCESSES IN BOTH PIPES
Number of data memory reads or writes that are paired in both pipes
of the pipeline.
- Pentium_10
0AH BANK CONFLICTS
Number of actual bank conflicts.
- Pentium_11
0BH MISALIGNED DATA MEMORY OR I/O REFERENCES
Number of memory or I/O reads or writes that are misaligned.
- Pentium_12
0CH CODE READ
Number of instruction reads.
- Pentium_13
0DH CODE TLB MISS
Number of instruction reads that miss the code TLB.
- Pentium_14
0EH CODE CACHE MISS
Number of instruction reads that miss the internal code cache.
- Pentium_15
0FH ANY SEGMENT REGISTER LOADED
Number of writes into any segment register in real or protected mode.
- Pentium_16
12H Branches
Number of taken or not taken branches, including conditional branches,
jumps, calls, returns, software interrupts, and interrupt returns.
- Pentium_17
13H BTB_HITS
Number of BTB hits that occur.
- Pentium_18
14H TAKEN_BRANCH_OR_BTB_HIT
Number of taken branches or BTB hits that occur.
- Pentium_19
15H PIPELINE FLUSHES
Number of pipeline flushes that occur.
- Pentium_20
16H INSTRUCTIONS_EXECUTED
Number of instructions executed (up to two per clock).
- Pentium_21
17H INSTRUCTIONS_EXECUTED_VPIPE
Number of instructions executed in the V_pipe. It indicated the number of
instructions that were paired.
- Pentium_22
18H BUS_CYCLE_DURATION
Number of clocks while a bus cycle is in progress. This event measures bus use.
- Pentium_23
19H WRITE_BUFFER_FULL_STALL_DURATION
Number of clocks while the pipeline is stalled due to full write buffers.
- Pentium_24
1AH WAITING_FOR_DATA_MEMORY_READ_STALL_DURATION
Number of clocks while the pipeline is stalled while waiting for data
memory reads.
- Pentium_25
1BH STALL_ON_WRITE_TO_AN_E-_OR_M-STATE_LINE
Number of stalls on writes to E- or M-state lines..
- Pentium_26
1CH LOCKED_BUS_CYCLE
Number of locked bus cycles that occur as the result of the LOCK prefix or
LOCK instruction, page-table updates, and descriptor table updates.
- Pentium_27
1DH I/O_READ_OR_WRITE_CYCLE
Number of bus cycles directed to I/O space.
- Pentium_28
1EH NONCACHEABLE_MEMORY_READS
Number of non-cacheable instruction or data memory read bus cycles.
- Pentium_29
1FH PIPELINE_AGI_STALLS
Number of address generation interlock (AGI) stalls.
- Pentium_30
22H FLOPS
Number of floating-point operations that occur. Transcendental instructions
consist of multiple adds and multiplies and will signal this event multiple
times. Instructions generating the divide-by-zero, negative square root,
special operand, or stack exceptions will not be counted. Instructions
generating all other floating-point exceptions will be counted. The integer
multiply instructions and other instructions which use the FPU will be counted.
- Pentium_31
23H BREAKPOINT_MATCH_ON_DR0_REGISTER
Number of matches on register DR0 breakpoint.
- Pentium_32
24H BREAKPOINT_MATCH_ON_DR1_REGISTER
Number of matches on register DR1 breakpoint.
- Pentium_33
25H BREAKPOINT_MATCH_ON_DR2_REGISTER
Number of matches on register DR2 breakpoint.
- Pentium_34
26H BREAKPOINT_MATCH_ON_DR3_REGISTER
Number of matches on register DR3 breakpoint.
- Pentium_35
27H HARDWARE_INTERRUPTS
Number of taken INTR and NMI interrupts.
- Pentium_36
28H DATA_READ_OR_WRITE
Number of memory data reads and/or writes.
- Pentium_37
29H DATA_READ_MISS_OR_WRITE_MISS
Number of memory read and/or write accesses that miss the internal data cache.
- Counter-specific events:
- Specific to counter 0:
- Pentium_C0_0
2AH BUS_OWNERSHIP_LATENCY
The time from LRM bus ownership request to bus ownership granted
(MMX extension).
- Pentium_C0_1
2CH CACHE_M-STATE_LINE_SHARING
Number of times a processor identified a hit to a modified line due to a
memory access in the other processor (MMX extension).
- Pentium_C0_2
2DH EMMS_INSTRUCTIONS_EXECUTED
Number of EMMS instructions executed (MMX extension).
- Pentium_C0_3
2EH BUS_UTILIZATION_DUE_TO_PROCESSOR_ACTIVITY
Number of clocks the bus is busy due to the processor's own activity
(MMX extension).
- Pentium_C0_4
30H NUMBER_OF_CYCLES_NOT_IN_HALT_STATE
Number of cycles the processor is not idle due to HLT instruction
(MMX extension).
- Pentium_C0_5
32H FLOATING_POINT_STALLS_DURATION
Number of clocks while pipe is stalled due to a floating-point freeze
(MMX extension).
- Pentium_C0_6
33H D1_STARVATION_AND_FIFO_IS_EMPTY
Number of times D1 stage cannot issue ANY instructions since the FIFO buffer
is empty (MMX extension).
- Pentium_C0_7
35H PIPELINE_FLUSHES_DUE_TO_WRONG_BRANCH_PREDICTIONS
Number of pipeline flushes due to wrong branch predictions resolved in either
the E-stage or the WB-stage (MMX extension).
- Pentium_C0_8
37H MISPREDICTED_OR_UNPREDICTED_RETURNS
Number of returns predicted incorrectly or not predicted at all
(MMX extension).
- Pentium_C0_9
39H RETURNS
Number of returns executed (MMX extension).
- Pentium_C0_10
3AH BTB_FALSE_ENTRIES
Number of false entries in the Branch Target Buffer (MMX extension).
- Specific to counter 1:
- Pentium_C1_0
2AH BUS_OWNERSHIP_TRANSFERS
Number of bus ownership transfers (MMX extension).
- Pentium_C1_1
2CH CACHE_LINE_SHARING
Number of shared data lines in the L1 cache (MMX extension).
- Pentium_C1_2
2EH WRITES_TO_NONCACHEABLE_MEMORY
Number of write accesses to non-cacheable memory (MMX extension).
- Pentium_C1_3
30H DATA_CACHE_TLB_MISS_STALL_DURATION
Number of clocks the pipeline is stalled due to a data cache translation
look-aside buffer miss (MMX extension).
- Pentium_C1_4
31H TAKEN_BRANCHES
Number of branches taken (MMX extension).
- Pentium_C1_5
33H D1_STARVATION_AND_ONLY_ONE_INSTRUCTION_IN_FIFO
Number of times the D1 stage issues just a single instruction since the
FIFO buffer had just one instruction ready (MMX extension).
- Pentium_C1_6
35H PIPELINE_FLUSHES_DUE_TO_WRONG_BRANCH_PREDICTIONS_RESOLVED_IN_WB-STAGE
Number of pipeline flushes due to wrong branch predictions resolved in the
WB-stage (MMX extension).
- Pentium_C1_7
37H PREDICTED_RETURNS
Number of predicted returns (MMX extension).
- Pentium_C1_8
3AH BTB_MISS_PREDICTION_ON_NOT_TAKEN_BRANCH
Number of times the BTB predicted a not-taken branch as taken
(MMX extension).
By default, the instructions RDMSR and WRMSR to access the
performance counter registers are kernel-mode instructions (ring 0).
In [12] are software tools concerning the performance counters on
Pentium-like processors described. On Linux systems,
libpperf
is available to access the performance counters. It was written by
M. Patrick Goda and Michael S. Warren from Los Alamos National
Laboratory. libpperf itself is based on the
msr
device implemented
by Stephan Meyer for Linux 2.0.x and 2.1.x.
Mikael Pettersson has written a kernel patch for all recent kernel
versions and a user library to access performance counters on Intel
IA32-processors (see
here)
for the package.
To keep binary compatibility with the predecessor processors, the
PentiumPro,
Pentium II, and
Pentium III
have 8
registers, 32 bit width each. First level cache is 8 KB for
instructions (ICache) and 8 KB for data (DCache) on PentiumPro, and 16
KB for both caches on Pentium II and Pentium III. As the PentiumPro,
Pentium II, and Pentium III are CISC-microprocessors (complex
instruction set computer), every instruction is divided internally
into micro-operations (UOP's) of fixed length. Dependent on the
complexity of the instruction, the instruction is divided into 1-4
UOP's.
The PentiumPro, Pentium II, and Pentium III has 2 performance counters
capable of counting a total of 77 different events (at most two at a
time), some of them with an additional unit mask as parameter to
further subdivide the event type. Some of the events are countable
only by a specific counter. The Pentium III has 4 additional events
concerning Streaming SIMD Extensions. Performancxe counter registers
are 40 bit wide, the time stamp counter is 64 bit wide. With special
instructions it is possible to write values into the performance
counter registers (WRMSR). Care has to be taken as this instruction
writes only the lower 32 bits, the upper 8 bits are sign extended from
bit 31. For the time stamp counter, the upper 8 bits are set to 0.
The Time Stamp Counter counts the elapsed machine cycles:
- PPro_TSC
elapsed machine cycles
The events countable by both performance counters are:
- PPro_0
43H DATA_MEM_REFS
All memory references, both cacheable and non-cacheable.
- PPro_1
45H DCU_LINES_IN
Number of allocated lines in the 1st level data cache.
- PPro_2
46H DCU_M_LINES_IN
Number of allocated lines in the 1st level data cache which have the status
modified.
- PPro_3
47H DCU_M_LINES_OUT
Number of evicted lines in the 1st level data cache which were marked as
modified.
- PPro_4
48H DCU_MISS_OUTSTANDING
Weighted number of cycles while a 1st level data cache miss is
outstanding. An access that also misses the L2 is short-changed by 2
cycles. (i.e. if counts N cycles, should be N+2 cycles.) Subsequent
loads to the same cache line will not result in any additional
counts. Count value not precise, but still useful.
- PPro_5
80H IFU_IFETCH
Number of 1st level instruction cache loads.
- PPro_6
81H IFU_IFETCH_MISS
Number of 1st level instruction cache misses.
- PPro_7
85H ITLB_MISS
Number of instruction transfer look-aside buffer misses.
- PPro_8
86H IFU_MEM_STALL
Number of cycles in which the instruction fetch pipe stage is stalled.
- PPro_9
87H ILD_STALL
Number of cycles the instruction length decoder is stalled.
- PPro_10
28H L2_IFETCH
Number of instruction fetches from the 2nd level cache.
- PPro_11
29H L2_LD
Number of data loads from the 2nd level cache.
- PPro_12
2AH L2_ST
Number of data stores to the 2nd level cache.
- PPro_13
24H L2_LINES_IN
Number of lines allocated in the 2nd level cache.
- PPro_14
26H L2_LINES_OUT
Number of cache lines removed from the 2nd level cache.
- PPro_15
25H L2_M_LINES_INM
Number of allocated cache lines in the 2nd level cache which have been
modified.
- PPro_16
27H L2_M_LINES_OUTM
Number of modified cache lines in the 2nd level cache which have been removed.
- PPro_17
2EH L2_RQSTS
Number of requests to the 2nd level cache.
- PPro_18
21H L2_ADS
Number of address strobes at 2nd level cache address bus.
- PPro_19
22H L2_DBUS_BUSY
Number of cycles during which the data bus was busy.
- PPro_20
23H L2_DBUS_BUSY_RD
Number of cycles during which the data bus was busy transferring data from 2nd
level cache to the processor.
- PPro_21
62H BUS_DRDY_CLOCKS
Number of cycles the DRDY-signal was active.
- PPro_22
63H BUS_LOCK_CLOCKS
Number of processor clock cycles during which the LOCK-signal is asserted.
- PPro_23
60H BUS_REQ_OUTSTANDING
Number of outstanding bus requests which either result out from a cacheable
read request of 1st level data cache lines or a to be completed bus operation.
- PPro_24
65H BUS_TRAN_BRD
Number of burst read transactions.
- PPro_25
66H BUS_TRAN_RFO
Number of read for ownership transactions.
- PPro_26
67H BUS_TRANS_WB
Number of write back transactions.
- PPro_27
68H BUS_TRAN_IFETCH
Number of completed instruction fetch transactions.
- PPro_28
69H BUS_TRAN_INVAL
Number of completed bus invalidate transactions.
- PPro_29
6AH BUS_TRAN_PWR
Number of completed partial write transactions.
- PPro_30
6BH BUS_TRANS_P
Number of completed partial transactions.
- PPro_31
6CH BUS_TRANS_IO
Number of completed I/O transactions.
- PPro_32
6DH BUS_TRAN_DEF
Number of completed deferred transactions.
- PPro_33
6EH BUS_TRAN_BURST
Number of completed burst transactions.
- PPro_34
70H BUS_TRAN_ANY
Number of all completed transactions.
- PPro_35
6FH BUS_TRAN_MEM
Number of completed memory transactions.
- PPro_36
64H BUS_DATA_RCV
Number of bus clock cycles during which this processor is receiving data.
- PPro_37
61H BUS_BNR_DRV
Number of bus clock cycles during which this processor is driving the BNR pin.
- PPro_38
7AH BUS_HIT_DRV
Number of bus clock cycles during which this processor is driving the HIT pin
including cycles due to snoop stalls.
- PPro_39
7BH BUS_HITM_DRV
Number of bus clock cycles during which this processor is driving the HITM pin
including cycles due to snoop stalls.
- PPro_40
7EH BUS_SNOOP_STALL
Number of clock cycles during which the bus is snoop stalled.
- PPro_41
03H LD_BLOCKS
Number of store buffer locks.
- PPro_42
04H SB_DRAINS
Number of cycles in which the store buffer blocks.
- PPro_43
05H MISALIGN_MEM_REF
Number of misaligned data memory references.
- PPro_44
C0H INST_RETIRED
Number of instructions retired.
- PPro_45
C2H UOPS_RETIRED
Number of micro-operations retired.
- PPro_46
D0H INST_DECODER
Number of instructions decoded and translated to UOP's.
- PPro_47
C8H HW_INT_RX
Number of hardware interrupts received.
- PPro_48
C6H CYCLES_INT_MASKED
Number of processor cycles for which interrupts are disabled.
- PPro_49
C7H CYCLES_INT_PENDIND_AND_MASKED
Number of ptrocessor cycles for which interrupts are disabled and interrupts
are pending.
- PPro_50
C4H BR_INST_RETIRED
Number of branch instructions retired.
- PPro_51
C5H BR_MISS_PRED_RETIRED
Number of completed but mispredicted branches.
- PPro_52
C9H BR_TAKEN_RETIRED
Number of completed taken branches.
- PPro_53
CAH BR_MISS_PRED_TAKEN_RET
Number of completed taken, but mispredicted branches.
- PPro_54
E0H BR_INST_DECODED
Number of decoded branch instructions.
- PPro_55
E2H BTB_MISSES
Number of branches that missed the BTB.
- PPro_56
E4H BR_BOGUS
Number of bogus branches.
- PPro_57
E6H BACLEARS
Number of times BACLEAR-signal is asserted.
- PPro_58
A2H RESOURCE_STALLS
Number of cycles during which there are resource related stalls.
- PPro_59
D2H PARTIAL_RAT_STALLS
Number of cycles or events for partial stalls.
- PPro_60
06H SEGMENT_REG_LOADS
Number of segment register loads.
- PPro_61
79H CPU_CLK_UNHALTED
Number of cycles during which the processor is not halted.
- PPro_62
B0H MMX_INSTR_EXEC
Number of MMX-instructions executed.
- PPro_63
B3H MMX_INSTR_TYPE_EXEC
Number of MMX-instructions executed. The further parameter unit mask specifies
which category should be counted.
- PPro_64
B1H MMX_SAT_INSTR_EXEC
MMX saturated instructions executed.
- PPro_65
B2H MMX_uOPS_EXEC
Number of MMX uops executed.
- PPro_66
CCH FP_MMX_TRANS
Transitions from MMX instructions to FP instructions.
- PPro_67
CDH MMX_ASSIST
Number of MMX assists (EMMS instructions executed).
- PPro_68
CEH MMX_INSTR_RET
Number of MMX instructions retired.
- PPro_69
D4H SEG_RENAME_STALLS
Segment register renaming stalls.
- PPro_70
D5H SEG_REG_RENAMES
Segment registers renamed.
- PPro_71
D6H RET_SEG_RENAMES
Number of segement register rename events retired.
- PPro_72
D8H EMON_SSE_INST_RETIRED
Number of Streaming SIMD extensions retired.
- PPro_73
D9H EMON_SSE_COMP_INST_RET
Number of Streaming SIMD Extensions computation instructions retired.
- PPro_74
07H EMON_SSE_PRE_DISPATCHED
Number of prefetch/weakly ordered instructios dispatched (inclusive
speculative prefetches).
- PPro_75
4BH EMON_SSE_PRE_MISS
Number of prefetch/weakly-ordered instructions that miss all caches.
- Counter-specific events:
- Specific to counter 0:
- PPro_C0_0
C1H FLOPS
Number of retired floating point instructions.
- PPro_C0_1
10H FP_COMP_OPS_EXE
Number of floating point operations started (but which may not have been all
completed.)
- PPro_C0_2
14H CYCLES_DIV_BUSY
Number of cycles during which the divider is busy.
- Specific to counter 1:
- PP1_0
11H FP_ASSIST
Number of floating-point exception cases handled by microcode.
- PP1_1
12H MUL
Number of multiplies (integer and floating-point).
- PP1_2
13H DIV
Number of divides (integer and floating-point).
All of the events can be counted on PentiumPro as well as on Pentium
II and Pentium III. The Pentium II and Pentium III have additional
events defined mainly for MMX-extensions [13].
The same remarks as stated above in the Pentium-section concerning
software environments apply to the Pentium Pro, Pentium II, and
Pentium III as well.
The performance monitoring mechanism provided in the
Intel Pentium 4
processors is considerably different from that provided in the P6
family and Pentium processors (and all other microprocessors). The
setup mechanism and MSR layouts are different and incompatible with
the P6 family and Pentium processor mechanism.
There are 3 types of registers relevant fpr performance counting:
- 45 ESCR (Event Selection Control Register) for selecting events
to be monitored by speficic performance counters. Each ESCR is usually
associated with a pair of PMC.
- 18 PMC (Performance Counter) organized in 9 pairs.
- 18 CCCR (Counter Configuration Contro Register) with one CCCR
accociated with each performance counter
The performance counters in conjunction with the counter configuration
control registers (CCCRs) are used for filtering and counting the
events selected by the ESCRs. The Pentium 4 and Intel Xeon processors
provide 18 performance counters organized into 9 pairs. A pair of
performance counters is associated with a particular subset of events
and ESCR's. Each performance counter is 40-bits wide.
The counter pairs are partitioned into four groups:
- The BPU group, includes two performance counter pairs:
MSR_BPU_COUNTER0 and MSR_BPU_COUNTER1
MSR_BPU_COUNTER2 and MSR_BPU_COUNTER3
- The MS group, includes two performance counter pairs:
MSR_MS_COUNTER0 and MSR_MS_COUNTER1
MSR_MS_COUNTER2 and MSR_MS_COUNTER3
- The FLAME group, includes two performance counter pairs:
MSR_FLAME_COUNTER0 and MSR_FLAME_COUNTER1
MSR_FLAME_COUNTER2 and MSR_FLAME_COUNTER3
- The IQ group, includes three performance counter pairs:
MSR_IQ_COUNTER0 and MSR_IQ_COUNTER1
MSR_IQ_COUNTER2 and MSR_IQ_COUNTER3
MSR_IQ_COUNTER4 and MSR_IQ_COUNTER5
The Time Stamp Counter counts the elapsed machine cycles:
- P4_TSC
elapsed machine cycles
The Pentium 4 has 18 performance counters. The following list shows
all measurable events. Each event can only be measured on specific
counter pairs, which belong to a specific counter group.
To be consistent with the numbering scheme we start numbering with
P4_CG0_xx for counter group 0.
Some events take more than one counter/CCCR/ESCR. See the Intel manual
for the details. Therefore the 1-to-1 mapping of low-level events and
counters doesn't hold for the P4 anymore.
The following short description of an event contains the hexadecimal
values for the ESCR event select, ESCR event mask and the CCCR select
(e.g. IOQ_allocation: Bus request type 03H (ESCR event select) 01H
(ESCR event mask) 06H (CCCR select)).
Below the short description a combination of event class and event name
is shown. All events of a class can be combined to a new one. By an
addition of the event mask values you can measure a specific combination
of events (e.g. branch_retired: If you want to count all taken branches
you have to combine branch taken predicted (04H) and branch taken
mispredicted (08H). In order to activate both events you must write 0CH
in the event mask field.).
Counter group 0 (Counter 1/2) is an exception and do not belong to the
counter groups above.
Currently, the generic low level driver interface does not work with
the P4.
- Counter 1-2 counts:
- Event class: IOQ_allocation
This event counts various types of transactions on the bus. A count will be
generated each time a transaction is allocated into the IOQ that matches the
specified mask bits. Note that requests are counted once per retry.
- P4_CG0_0
03H 01H 06H
IOQ_allocation: Bus request type
- P4_CG0_1
03H 20H 06H
IOQ_allocation: Count read entries
- P4_CG0_2
03H 40H 06H
IOQ_allocation: Count write entries
- P4_CG0_3
03H 80H 06H
IOQ_allocation: Count UC memory access entries
- P4_CG0_4
03H 100H 06H
IOQ_allocation: Count WC memory access entries
- P4_CG0_5
03H 2000H 06H
IOQ_allocation: Count all store requests driven by processor, as opposed to other processor or DMA
- P4_CG0_6
03H 4000H 06H
IOQ_allocation: Count all requests driven by other processor or DMA
- P4_CG0_7
03H 8000H 06H
IOQ_allocation: Include HW and SW prefetch requests in the count
- Event class: BSQ_allocation
This event counts allocations in the bus sequence unit (BSQ) according to
specified mask bit encodings.
- P4_CG0_8
05H 00H 07H
BSQ_allocation: request type encodings (read)
- P4_CG0_9
05H 01H 07H
BSQ_allocation: request type encodings (read invalidate)
- P4_CG0_10
05H 02H 07H
BSQ_allocation: request type encodings (write)
- P4_CG0_11
05H 03H 07H
BSQ_allocation: request type encodings (writeback)
- P4_CG0_12
05H 00H 07H
BSQ_allocation: request length encodings (0 chunks)
- P4_CG0_13
05H 04H 07H
BSQ_allocation: request length encodings (1 chunk)
- P4_CG0_14
05H 12H 07H
BSQ_allocation: request length encodings (8 chunks)
- P4_CG0_15
05H 200H 07H
BSQ_allocation: request type is a demand
- P4_CG0_16
05H 00H 07H
BSQ_allocation: memory type encodings (UC)
- P4_CG0_17
05H 800H 07H
BSQ_allocation: memory type encodings (USWC)
- P4_CG0_18
05H 2000H 07H
BSQ_allocation: memory type encodings (WT)
- P4_CG0_19
05H 2800H 07H
BSQ_allocation: memory type encodings (WP)
- P4_CG0_20
05H 3000H 07H
BSQ_allocation: memory type encodings (WB)
- Counter 1-4 counts:
- Event class: BPU_fetch_request
This event counts instruction fetch requests of specified request type by the
branch prediction unit.
- P4_CG1_0
03H 01H 00H
BPU_fetch_request: Trace cache lookup miss
- Event class: ITLB_reference
This event counts translations using the instruction translation lookaside buffer.
- P4_CG1_1
18H 01H 03H
ITLB_reference: ITLB hit
- P4_CG1_2
18H 02H 03H
ITLB_reference: ITLB miss
- P4_CG1_3
18H 04H 03H
ITLB_reference: Uncacheable ITLB hit
- Event class: MOB_load_replay
This event triggers if the memory order buffer caused a load operation to be replayed.
- P4_CG1_4
03H 02H 02H
MOB_LOAD_replay: Replayed because of unknown store address
- P4_CG1_5
03H 04H 02H
MOB_LOAD_replay: Replayed because of unknown store data
- P4_CG1_6
03H 08H 02H
MOB_LOAD_replay: Replayed because of partially overlapped data access between the load and store operations
- P4_CG1_7
03H 10H 02H
MOB_LOAD_replay: Replayed because the lower four bits of the linear address do not match between the load and store operations
- Event class: page_walk_type
This event counts various types of page walks that the page miss handler (PMH) performs.
- P4_CG1_8
01H 01H 04H
page_walk_type: Page walk for a data TLB miss (either load or store)
- P4_CG1_9
01H 02H 04H
page_walk_type: Page walk for an instruction page miss
- Event class: BSQ_2ndL_cache_reference
This event counts second level cache references as seen by the bus unit.
- P4_CG1_10
0CH 01H 07H
BSQ_2ndL_cache_reference: Read 2nd level cache hit (shared)
- P4_CG1_11
0CH 02H 07H
BSQ_2ndL_cache_reference: Read 2nd level cache hit (exclusive)
- P4_CG1_12
0CH 04H 07H
BSQ_2ndL_cache_reference: Read 2nd level cache hit (modified)
- P4_CG1_13
0CH 100H 07H
BSQ_2ndL_cache_reference: Read 2nd level cache miss
- P4_CG1_14
0CH 400H 07H
BSQ_2ndL_cache_reference: Write 2nd level cache miss
- Event class: FSB_data_activity
This event increments once for each DRDY or DBSY event that occurs on the front side bus.
- P4_CG1_15
17H 01H 06H
FSB_data_activity: Count DRDY event that we drive
- P4_CG1_16
17H 02H 06H
FSB_data_activity: Count DRDY event sampled that we own
- P4_CG1_17
17H 04H 06H
FSB_data_activity: Count DRDY event driven by the chipset or a another processor
- P4_CG1_18
17H 08H 06H
FSB_data_activity: Count DBSY event that we drive
- P4_CG1_19
17H 10H 06H
FSB_data_activity: Count DBSY event sampled that we own
- P4_CG1_20
17H 20H 06H
FSB_data_activity: Count DBSY event driven by the chipset or a another processor
- Counter 5-8 counts:
- Event class: TC_deliver_mode
This event counts the duration (in clock cycles) of the trace cache operating modes.
- P4_CG2_0
01H 04H 01H
TC_deliver_mode: TC is delivering traces
- P4_CG2_1
01H 20H 01H
TC_deliver_mode: TC is building traces while encoding instructions
- Counter 9-12 counts:
- Event class: memory_cancel
This event counts the canceling of various type of requests the data cache address
control unit (DAC).
- P4_CG3_0
02H 04H 05H
memory_cancel: replayed because no store request buffer is available
- P4_CG3_1
02H 80H 05H
memory_cancel: replayed due to missing from all onchip caches
- Event class: memory_complete
This event counts the completion of a load split, store split, uncacheable split or
UC load.
- P4_CG3_2
08H 01H 02H
memory_complete: load split completed, excluding UC, WC loads
- P4_CG3_3
08H 02H 02H
memory_complete: any split store completed
- Event class: load_port_replay
This event counts replayed events at the load port.
- P4_CG3_4
04H 02H 02H
load_port_replay: split load
- P4_CG3_5
05H 02H 02H
load_port_replay: split store
- Event class: SSE_input_assist
This event counts the number of times an assist is requestet to handle problems with
input operands for SSE and SSE2 operation.
- P4_CG3_6
34H 8000H 02H
SSE_input_assist: count assists for all SSE and SSE2 ops
- Event class: packed_SP_uop
This event increments for each packed single-precision op.
- P4_CG3_7
08H 8000H 01H
packed_SP_uop: count all ops operating on packed single-precision operands
- Event class: packed_DP_uop
This event increments for each packed double-precision op, specified through the event
mask for detection.
- P4_CG3_8
0CH 8000H 01H
packed_DP_uop: count all ops operating on packed double-precision operands
- Event class: scalar_SP_uop
This event increments for each scalar singe-precicion op.
- P4_CG3_9
0AH 8000H 01H
scalar_SP_uop: count all ops operating on scalar single-precision operands
- Event class: scalar_DP_uop
This event increments for each scalar double-precicion op.
- P4_CG3_10
0EH 8000H 01H
scalar_DP_uop: count all ops operating on scalar double-precision operands
- Event class: 64bit_MMX_uop
This event counts all ops operationg on 64bit SIMD integer operands in memory
or MMX registers.
- P4_CG3_11
02H 8000H 01H
64bit_MMX_uop: count all ops operating on 64bit SIMD integer operands in memeory or MMX registers
- Event class: 128bit_MMX_uop
This event counts all ops operationg on 128bit SIMD integer operands in memory
or MMX registers.
- P4_CG3_12
1AH 8000H 01H
128bit_MMX_uop: count all ops operating on 128bit SIMD integer operands in memeory or MMX registers
- Event class: x87_FP_uop
This event increments for each x87 floating point op.
- P4_CG3_13
04H 8000H 01H
x87_FP_uop: count all x87 floating point ops
- Event class: x87_SIMD_moves_uop
This event incements for each x87, MMX, SSE or SSE2 op related to load data, store data,
or register-to-register moves.
- P4_CG3_14
2EH 08H 01H
x87_SIMD_moves_uop: count all x87/SIMD store/moves op
- P4_CG3_15
2EH 10H 01H
x87_SIMD_moves_uop: count all x87/SIMD load op
- Counter 13-18 counts:
- Event class: branch_retired
This event counts the retirement of a branch.
- P4_CG4_0
06H 01H 05H
branch_retired: branch not-taken predicted
- P4_CG4_1
06H 02H 05H
branch_retired: branch not-taken mispredicted
- P4_CG4_2
06H 04H 05H
branch_retired: branch taken predicted
- P4_CG4_3
06H 08H 05H
branch_retired: branch taken mispredicted
- Event class: mispred_branch_retired
This event represents the retirement of mispredicted IA32 branch instructions.
- P4_CG4_4
03H 01H 04H
mispred_branch_retired: the retired instruction is not bogus
- Event class: x87_assist
This event counts the retirement of x87 instruction that required special handling.
- P4_CG4_5
03H 01H 05H
x87_assist: handle FP stack underflow
- P4_CG4_6
03H 02H 05H
x87_assist: handle FP stack overflow
- P4_CG4_7
03H 04H 05H
x87_assist: handle x87 output overflow
- P4_CG4_8
03H 08H 05H
x87_assist: handle x87 output underflow
- P4_CG4_9
03H 10H 05H
x87_assist: handle x87 input assist
- Event class: machine_clear
This event increments according to the mask bit specified while the entire pipline of
the machine is cleared.
- P4_CG4_10
02H 01H 05H
machine_clear: counts for a portion of the many cycles while the machine is cleared for any cause
- P4_CG4_11
02H 02H 05H
machine_clear: increments each time the machine is cleared due to memory ordering issues
- Event class: front_end_event
This event counts the retirement of tagged ops which are specified through the front end tagging mechanism.
- P4_CG4_12
08H 01H 05H
front_end_event: the marked ops are not bogus
- P4_CG4_13
08H 02H 05H
front_end_event: the marked ops are bogus
- Event class: execution_event
This event counts the retirement of tagged ops which are specified through the execution tagging mechanism.
- P4_CG4_14
0CH 0FH 05H
execution_event: the marked ops are not bogus
- P4_CG4_15
0CH F0H 05H
execution_event: the marked ops are bogus
- Event class: replay_event
This event counts the retirement of tagged ops which are specified through the replay tagging mechanism.
- P4_CG4_16
09H 01H 05H
replay_event: the marked ops are not bogus
- P4_CG4_17
09H 02H 05H
replay_event: the marked ops are bogus
- Event class: instr_retired
This event counts instructions that are retired during a clock cycle.
- P4_CG4_18
02H 01H 04H
instr_retired: Non-bogus instructions that are not tagged
- P4_CG4_19
02H 02H 04H
instr_retired: Non-bogus instructions that are tagged
- P4_CG4_20
02H 04H 04H
instr_retired: bogus instructions that are not tagged
- P4_CG4_21
02H 08H 04H
instr_retired: bogus instructions that are tagged
- Event class: uops_retired
This event counts ops that are retired during a clock cycle.
- P4_CG4_22
01H 01H 04H
uops_retired: the marked ops are not bogus
- P4_CG4_23
01H 02H 04H
uops_retired: the marked ops are bogus
The AMD Athlon
is a
32-bit CISC microprocessor. The Athlon has 4 performance counters.
The performance counters are 48 bit wide, the time stamp counter is 64 bit wide.
The Time Stamp Counter counts the elapsed machine cycles:
- Athlon_TSC
elapsed machine cycles
The events countable on all four counters
are:
- ATHLON_0
20H
Segment register loads.
- ATHLON_1
21H
Stores to active instruction stream (self-modifying code occurences).
- ATHLON_2
40H
Data cache accesses.
- ATHLON_3
41H
Data cache misses.
- ATHLON_4
42H
Data cache refills from L2.
- ATHLON_5
43H
Data cache refills from system.
- ATHLON_6
44H
Data cache writebacks.
- ATHLON_7
45H
L1 DTLB misses and L2 DTLB hits.
- ATHLON_8
46H
L1 and L2 DTLB misses.
- ATHLON_9
47H
Missaligned data references.
- ATHLON_10
64H
DRAM system requests.
- ATHLON_11
65H
System request with the selected type.
- ATHLON_12
73H
Snoop hits.
- ATHLON_13
74H
Single bit ecc errors detected or corrected.
- ATHLON_14
75H
Internal cache line invalidates.
- ATHLON_15
76H
Cycles processor is running.
- ATHLON_16
79H
L2 request.
- ATHLON_17
7AH
Cycles that at least one fill request waited to use the L2.
- ATHLON_18
80H
Instruction cache fetches.
- ATHLON_19
81H
Instruction cache misses.
- ATHLON_20
82H
Instruction cache refills from L2.
- ATHLON_21
83H
Instruction cache refills from system.
- ATHLON_22
84H
L1 ITLB misses and L2 ITLB hits.
- ATHLON_23
85H
L1 and L2 ITLB misses.
- ATHLON_24
86H
Snoop resyncs.
- ATHLON_25
87H
Instruction fetch stall cycles.
- ATHLON_26
88H
Return stack hits.
- ATHLON_27
89H
Return Stack overflow.
- ATHLON_28
C0H
Retired instructions (includes exceptions, interrupts, resyncs).
- ATHLON_29
C1H
Retired Ops.
- ATHLON_30
C2H
Retired branches (conditional, unconditional, exceptions, interrupts).
- ATHLON_31
C3H
Retired branches misspredicted.
- ATHLON_32
C4H
Retired taken branches.
- ATHLON_33
C5H
Retired taken branches misspredicted.
- ATHLON_34
C6H
Retired far control transfers.
- ATHLON_35
C7H
Retired resync branches (only non-control transfer branches counted).
- ATHLON_36
C8H
Retired near returns.
- ATHLON_37
C9H
Retired near returns mispredicted.
- ATHLON_38
CAH
Retired indirect branches with target mispredicted.
- ATHLON_39
CDH
Interruptes masked cycles (IF=0).
- ATHLON_40
CEH
Interrupts masked while pending cycles (INTR while IF=0).
- ATHLON_41
CFH
Number of taken hardware interrupts.
- ATHLON_42
D0H
Instruction decorder empty.
- ATHLON_43
D1H
Dispatch stalls.
- ATHLON_44
D2H
Branch aborts to retire.
- ATHLON_45
D3H
Serialize.
- ATHLON_46
D4H
Segment load stall.
- ATHLON_47
D5H
ICU full.
- ATHLON_48
D6H
Reservation stations full.
- ATHLON_49
D7H
FPU full.
- ATHLON_50
D8H
LS full.
- ATHLON_51
D9H
All quiet stall.
- ATHLON_52
DAH
Far transfer or resync brach pending.
- ATHLON_53
DCH
Breakpoint matches for DR0.
- ATHLON_54
DDH
Breakpoint matches for DR1.
- ATHLON_55
DEH
Breakpoint matches for DR2.
- ATHLON_56
DFH
Breakpoint matches for DR3.
A performance counter is called in Intel's literature
[14] a PMC. In the Itanium 1 processor there are 4
counters numbered PMC4 to PMC7. To be consistent with the rest of the
document we map those counter numbers to the names PMC0, PMC1, PMC2,
PMC3, e.g. PMC 4 is called in our document PMC0.
The SR8000 processors have 8 performance counter registers, each
counting exactly one hard-coded event type.
- SR8000_C0
ITLB misses
Instruction TLB misses
- SR8000_C1
DTLB misses
Data TLB misses
- SR8000_C2
Icache misses
L1 instruction cache misses
- SR8000_C3
Dcache misses
L1 data cache misses
- SR8000_C4
Loadstore
Load or store operations
- SR8000_C5
Instructions
Instructions completed
- SR8000_C6
Cycle_cnt
Machine cycles.
- SR8000_C7
FP-ops
Floating point operations
Rudolf
2003-01-02